
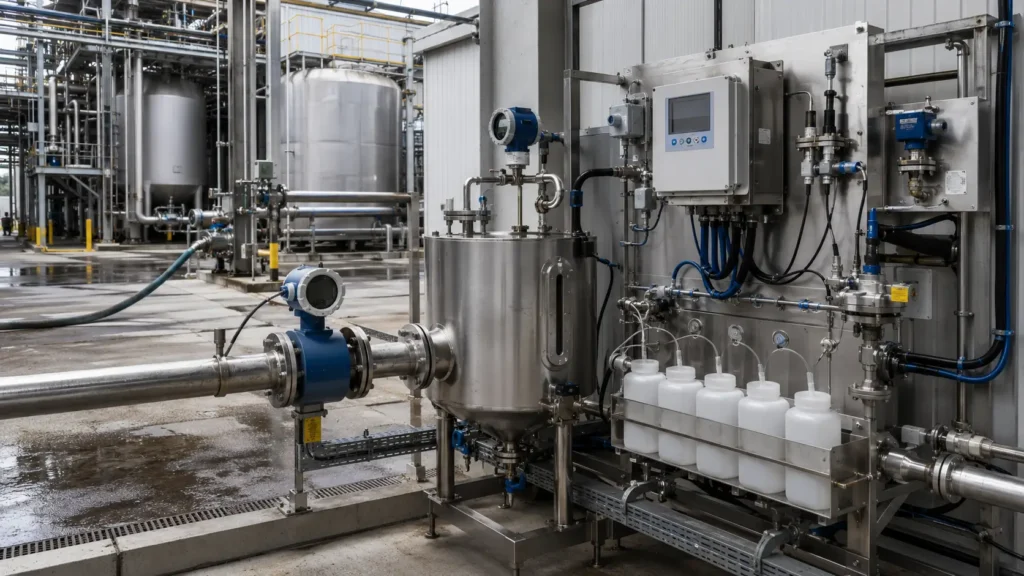
Define the analytical and operating data set that can support modelling, technology screening and residual accounting.
Controlled principleCharacterization is the conversion of a named wastewater stream into a reproducible design basis. It combines the operating envelope, field properties, laboratory composition, process-chemical history and required outputs. A single analysis, a TDS value or an incomplete laboratory certificate cannot carry that burden. |
|---|
6.1 Characterization is a design basis, not a laboratory certificate
Chapter 5 reduced the facility to named residual streams after source reduction, segregation and reuse. Characterization now defines each remaining stream well enough to support water and salt balances, geochemical and process modelling, treatment screening, materials selection, residual management and product qualification. The required data are therefore determined by the decisions the project must make—not by a generic laboratory package.
A laboratory certificate is only one component. The same analytical result can imply different equipment duty when the flow is continuous or batched, when it occurs during normal production or cleaning, when the sample represents a tank composite or a short purge, and when additives continue reacting after collection. Every result must remain attached to a stream name, sampling point, operating state, date, method, unit, fraction and quality note.
EPA’s Clean Water Act methods framework illustrates the discipline: approved methods are defined for particular analytes, matrices and regulatory uses, and method selection remains separate from the engineering interpretation of the result. USGS field guidance likewise treats preparation, collection, processing and field measurements as an integrated quality system rather than interchangeable laboratory steps.
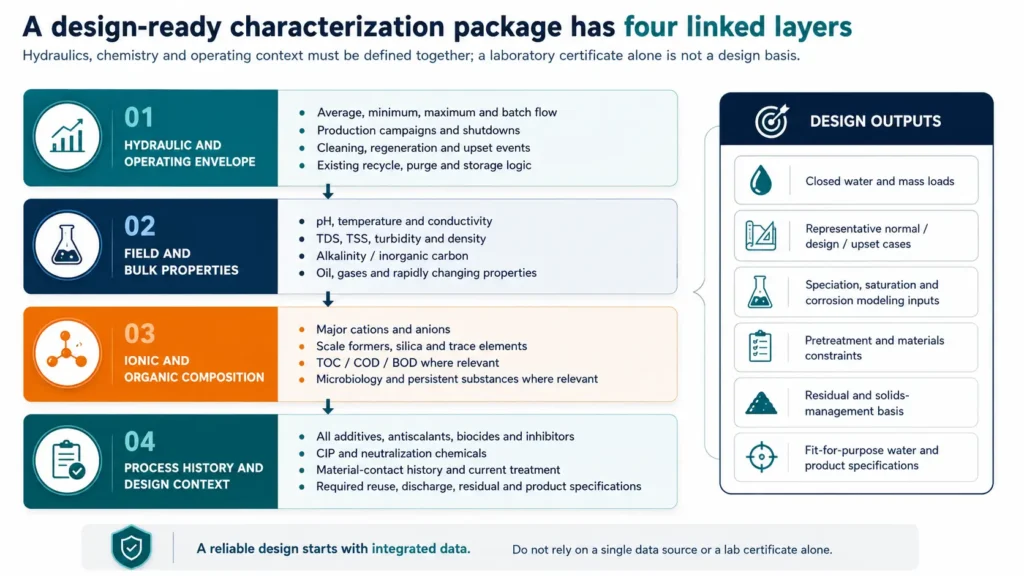
Figure 6.1. A design-ready characterization package links hydraulics, chemistry and operating context.
6.2 Start with the hydraulic and operating envelope
Concentration without flow is not a load, and an average flow is not a design envelope. The request should distinguish average, minimum, normal maximum, design maximum and physically credible upset flows. Batch volume, duration, frequency, drain-down pattern and available equalization must be stated. Where flow is inferred from tank level, pump operation or production data, the calculation and uncertainty should remain visible.
The analytical campaign must be mapped to production. Product grade, ore blend, feedstock, cooling duty, evaporation rate, regeneration sequence, cleaning-in-place cycle, shutdown, start-up and seasonal condition can each create a different wastewater. The owner should provide the production and chemical-use records needed to identify those states. Chapter 7 will determine the sampling timeline; Chapter 6 defines the states that the timeline must represent.
| Hydraulic / operating field | Required basis | Design use | Common failure |
|---|---|---|---|
| Stream identity and sampling point | Process unit, collection point, upstream additions, downstream blending and declared boundary. | Preserves origin and defines what the analysis represents. | Calling all collected liquids “brine” or using a sample from a mixed sump. |
| Average and normal range | Time-weighted flow by operating mode and production period. | Mass loads, normal equipment duty and annual balance. | Using an arithmetic average of irregular grab readings. |
| Minimum and turndown | Lowest sustained flow and zero-flow periods. | Control philosophy, minimum circulation and storage. | Assuming continuous operation for a campaign stream. |
| Maximum / design flow | Maximum sustained and short-duration hydraulic peaks, with duration. | Hydraulic sizing, equalization and redundancy. | Sizing on the highest instantaneous meter value without duration. |
| Batch events | Volume, duration, frequency, sequence and composition by event. | Tankage, transfer rate and batch-specific treatment. | Averaging a two-hour CIP event into a monthly flow. |
| Production and cleaning cycles | Product grade, throughput, campaign, start-up, shutdown, CIP and regeneration records. | Connects chemistry to operating state. | Sampling a convenient day and labelling it representative. |
| Recycle, purge and storage | Internal recycles, purge logic, residence time, tank inventory and carryover. | Identifies accumulation, dilution and delayed release. | Treating recycle flow as new water or ignoring inventory change. |
Table 6.1. Hydraulic and operating data required to convert concentrations into design loads.
6.3 Field and bulk properties define the physical matrix
Some properties change quickly or depend strongly on temperature and measurement conditions. pH, temperature, specific conductance, oxidation-reduction conditions and dissolved gases should therefore be measured as close as practical to the process state they are intended to describe. USGS field guidance treats calibration, stabilization, measurement and reporting as controlled procedures; laboratory values should not silently replace field values when the property can change during cooling, aeration or storage.
TDS and TSS remain useful but must be tied to method and fraction. EPA gravimetric residue methods define filterable and non-filterable residues operationally through filtration and drying procedures. They do not identify ions, speciation, oil, volatile material or colloidal behaviour. Conductivity is a rapid electrical response, not a universal TDS conversion. Density is needed wherever volumetric flow and concentration are converted into mass load, especially as salinity increases.
Alkalinity is an acid-neutralizing capacity reported on a stated basis; it is not automatically equal to bicarbonate concentration. Inorganic carbon, pH, temperature and gas exchange are needed to interpret carbonate speciation. Ionic strength is calculated from the concentration and charge of the ions, I = 0.5 × Σ(cᵢzᵢ²), and therefore cannot be reconstructed reliably from TDS alone.
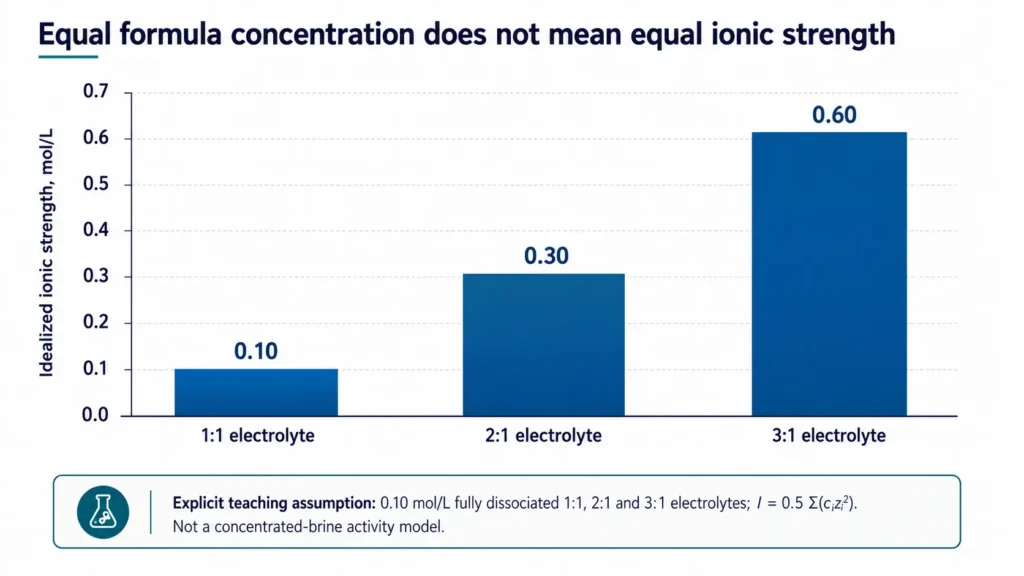
Figure 6.2. Idealized teaching calculation: equal formula concentration can produce very different ionic strength.
| Property | Minimum reporting basis | Why it matters | Cross-check | Boundary / caution |
|---|---|---|---|---|
| pH | Field and laboratory value; temperature; method; stabilization note. | Speciation, precipitation, corrosion, biological activity and chemical dose. | Alkalinity, inorganic carbon, acid/base history. | An activity-based measurement; dilution can change the value. |
| Temperature | At sampling point and at expected treatment conditions. | Solubility, kinetics, viscosity, membrane flux, corrosion and gas release. | Process historian and heat balance. | A cooled sample may not represent the operating stream. |
| Specific conductance | Measured value, reference temperature and instrument range. | Rapid tracking of dissolved ionic change and event detection. | Major-ion sum, TDS and density trend. | No universal conductivity-to-TDS factor. |
| TDS / filterable residue | Method, filter basis, drying condition, dilution and units. | Bulk dissolved-residue inventory and first-pass balance. | Speciated ions and conductivity. | Hygroscopic salts, bicarbonate transformation and volatile constituents can bias interpretation. |
| TSS / turbidity / particle size | Method and sampling/mixing conditions; particle distribution where relevant. | Clarification, filtration, erosion, sludge and fouling duty. | Settling observation, microscopy or solids mass. | A grab from a quiescent tank may miss settleable solids. |
| Density | Measured at stated temperature and concentration. | Converts volumetric flow and mg/L data to mass flow; affects hydraulics. | TDS / major-ion model. | Do not assume 1.000 kg/L for concentrated brines. |
| Alkalinity / inorganic carbon | Titration basis, endpoints, units as CaCO₃ or species; DIC/TIC where needed. | Carbonate speciation, acid demand and scaling. | pH, calcium, gas history and modelling. | Alkalinity is not synonymous with bicarbonate. |
| Ionic strength | Calculated from a complete ionic composition using a stated model/basis. | Activities, osmotic behaviour, analytical interferences and equilibrium modelling. | Charge balance, density and speciation model. | At high salinity, activity models and database suitability matter. |
Table 6.2. Field and bulk properties: required reporting basis and engineering interpretation.
6.4 Major ions provide the minimum chemical skeleton
A design-ready analysis should include the ions that carry most of the charge and the species that control the next treatment step. For many saline streams, the starting cations are sodium, potassium, calcium and magnesium; the starting anions are chloride, sulfate, alkalinity or inorganic carbon, nitrate, fluoride, phosphate and bromide where relevant. Barium, strontium, silica, iron, aluminium and other site-specific scale or fouling constituents can be controlling at much lower concentrations.
EPA Method 300.0 covers common inorganic anions in water and mixed domestic and industrial wastewater, while EPA metals methods such as 200.7 and 200.8 cover multi-element analysis by ICP techniques. Their existence does not mean every method is automatically suitable at native brine concentration. Dilution, spectral or matrix interference, digestion, total-recoverable versus dissolved fraction, reporting limits and laboratory validation must be documented.
The analytical table should preserve how each result is reported: as element or ion, as nitrogen or nitrate, as sulfur or sulfate, as CaCO₃ equivalent, and on a mass-per-volume or mass-per-mass basis. Silent basis conversion is a common source of order-of-magnitude error.
| Chemical family | Minimum analytes / information | Primary design questions | Reporting traps to prevent |
|---|---|---|---|
| Major cations | Na, K, Ca, Mg; ammonium where relevant. | Osmotic burden, hardness, softening dose, membrane selectivity and products. | Element versus compound basis; dissolved versus total recoverable. |
| Major anions | Cl, SO₄, alkalinity/inorganic carbon, NO₃/NO₂, F, PO₄, Br where relevant. | Salt inventory, scaling sequence, corrosion, nutrient or oxidant chemistry. | As N versus as ion; as S versus sulfate; alkalinity as CaCO₃. |
| Scale-forming trace species | Ba, Sr, silica/silicate, phosphate, fluoride, iron, aluminium and site-specific species. | Recovery limit, selective removal, seeding, sludge and cleaning strategy. | Detection limit after large dilution; colloidal versus dissolved fraction. |
| Redox and gases | Sulfide, dissolved oxygen, ORP/pe, carbon dioxide, ammonia and other process gases where relevant. | Safety, corrosion, odour, precipitation, oxidation and stripping. | Loss or oxidation during sampling and storage. |
| Elemental trace inventory | Metals/metalloids selected from geology, raw materials, catalysts, corrosion and permit history. | Toxicity, product purity, solids classification and materials. | Assuming a generic metals scan is complete or suitably sensitive. |
Table 6.3. Major-ion and trace-inorganic package for mass balance, speciation and treatment screening.
Analytical closure is a diagnostic, not permission to invent chemistryCharge balance, measured-ion sums, conductivity, density and gravimetric TDS should be cross-checked. A poor closure can indicate omitted ions, basis errors, dilution mistakes, unreported additives or sample change. The missing charge should not be silently assigned to a convenient ion. Chapter 7 defines how discrepancies are investigated and how uncertainty is carried into normal, design and upset cases. |
|---|
6.5 Organics, biology, oil and solids can control treatability
Salinity does not remove the need to characterize non-salt loads. TOC, COD and BOD answer different questions and are not interchangeable. TOC measures carbon by the selected method; COD measures an oxidizable demand under defined conditions; BOD depends on biological response and can be inhibited by salinity or toxic constituents. The appropriate combination depends on whether the project must protect biological treatment, prevent membrane fouling, control evaporator foaming or qualify a recovered product.
Oil and grease requires a defined method and fraction. EPA Method 1664B measures n-hexane extractable material and a silica-gel-treated non-polar fraction; it is an operational method, not a complete petroleum speciation. Emulsified oil, surfactants, solvents and volatile organics may require additional tests.
Biological characterization should be activated by the process and objective: microbial counts, ATP, pathogens, sulphate-reducing or acid-producing activity, biomass solids, or inhibition testing may be relevant. EPA maintains separate approved microbiological and whole-effluent-toxicity methods, reinforcing that biological condition is not represented by TDS or COD alone.
| Parameter family | Request when | Design relevance | Interpretive limit |
|---|---|---|---|
| TOC / dissolved organic carbon | Organics may foul membranes, carry into condensate or affect product purity. | Organic mass, fouling and thermal carryover screening. | Does not identify compounds or biodegradability. |
| COD / BOD | Biological treatment, oxidant demand or mixed industrial organics matter. | Biological load, inhibition risk and oxidation demand. | Method-specific; saline and toxic matrices can bias biological response. |
| Oil and grease / non-polar material | Produced water, refinery, metalworking, food or oily process contact. | Pretreatment, membrane wetting, foaming and sludge. | Operational extraction result; not full hydrocarbon speciation. |
| Volatile / semivolatile organics | Solvents, fuels, process intermediates or odour are plausible. | Safety, emissions, condensate quality and treatment compatibility. | Requires analyte list, preservation and headspace control. |
| Microbiology / activity | Biological treatment, biofouling, souring, pathogens or long storage matter. | Biocide strategy, biofouling, inhibition and reuse risk. | Counts and activity measurements answer different questions. |
| TSS / colloids / particle size | Clarification, filtration, precipitation or slurry handling is expected. | Solids separation, erosion, filter loading and dewatering. | Filtered “dissolved” results may still include fine colloids depending on method. |
Table 6.4. Non-salt loads that frequently control pretreatment, reliability and residual quality.
6.6 Metals, radionuclides and persistent substances are site-specific modules
The characterization package should expand where geology, raw materials, catalysts, corrosion, production chemicals, historical releases, permits or product specifications create a credible pathway. A universal scan can waste money and still miss the controlling substance. The analyte list should be linked to a source hypothesis and a decision.
EPA maintains approved radiochemical methods for specified applications and separate methods for metals and organic pollutants. For PFAS, EPA Method 1633A provides an isotope-dilution LC-MS/MS method for aqueous and other matrices, while Method 1621 measures adsorbable organic fluorine as a broader screening parameter; EPA notes that regulatory approval status can differ by method and program. The project must therefore distinguish screening, design characterization and compliance monitoring.
| Module | Trigger | Minimum documentation | Design / commercial consequence |
|---|---|---|---|
| Metals and metalloids | Ore, formation water, catalyst, corrosion, plating, pigment, ash, leachate or permit history. | Total / dissolved / total-recoverable basis, preparation, method, dilution and reporting limit. | Toxicity, precipitation, sludge classification, corrosion and product purity. |
| Radionuclides | Formation water, mining, geothermal, phosphate, scale or regulatory history. | Target isotopes or screening parameters, method, activity units and uncertainty. | Worker safety, waste classification, disposal route and product acceptance. |
| PFAS and persistent organics | AFFF, fluorochemical use, textiles, plating, landfill, contaminated source or permit requirement. | Target list or aggregate parameter, method version, blanks, reporting limits and matrix performance. | Discharge, concentrate liability, product rejection and treatment selection. |
| Active compounds / toxicity | Pharmaceutical, pesticide, biocide or specialty-chemical manufacture. | Named compounds, transformation products, bioassays or WET where justified. | Biological inhibition, residual classification and reuse restriction. |
Table 6.5. Site-specific analytical modules should follow credible source pathways and decisions.
6.7 Process additives and cleaning chemicals belong in the feed definition
A complete analysis can still be misleading when the process history is missing. Antiscalants, coagulants, flocculants, corrosion inhibitors, biocides, oxygen scavengers, acids, alkalis, oxidants, reducing agents, solvents, extractants, catalysts, surfactants, defoamers and cleaning chemicals can change speciation, scaling, fouling, product purity and analytical response.
The owner should provide the chemical name, active ingredient, formulation where available, dose range, frequency, injection point, campaign, neutralization step and expected residual. Safety data sheets are useful but are not a dosing history. Proprietary formulations may require confidential disclosure to the engineering and laboratory teams or targeted compatibility tests.
| Chemical / event | Active information required | Where introduced | When present | Why the designer needs it |
|---|---|---|---|---|
| Routine process additive | Product name, active ingredient, concentration and dose range. | Exact unit and upstream/downstream relation to sample. | Continuous, intermittent or production-specific. | Mass balance, reaction chemistry, fouling and product purity. |
| CIP / cleaning event | Acid, alkali, surfactant, chelant, oxidant, temperature and rinse sequence. | Equipment and collection route. | Batch volume, duration and frequency. | Peak pH/COD/TDS, compatibility, equalization and residual route. |
| Regeneration | Regenerant, strength, stoichiometry, displacement and rinse volumes. | IX, softener, adsorbent or cyclic process. | Cycle trigger and sequence. | Salt load, displaced ions, batch storage and reuse potential. |
| Upset / spill response | Material, neutralization and containment chemicals. | Affected drainage and tanks. | Credible frequency and maximum event. | Worst-case composition, safety and contingency capacity. |
Table 6.6. Process chemicals and episodic events must be treated as feed constituents.
6.8 Method, units and matrix performance are part of every result
A number without its analytical basis is incomplete. Each result should identify the method and revision, laboratory, sample fraction, preparation, preservation, dilution, units, reporting limit, qualifier and quality-control outcome. Where compliance monitoring applies, the approved method and permit requirements control. Where the data support engineering design, the method must also be demonstrated fit for the actual matrix and concentration range.
High-salinity samples can exceed calibration ranges and create ion-chromatographic, spectroscopic, extraction or gravimetric interferences. EPA guidance on Clean Water Act analytical problems emphasizes documenting matrix interference and using appropriate method controls. Matrix spikes, blanks, duplicates, serial dilution, reference materials and recovery data help distinguish a real concentration from an analytical artefact. Detection is not the same as reliable quantitation; the project reporting limit must be below the level at which the analyte changes a design or compliance decision.
Thermodynamic modelling also requires a declared basis. PHREEQC can calculate aqueous speciation, saturation indices, density, conductance and charge balance using selected activity models, including Pitzer or SIT formulations for non-ideal solutions. Model output remains conditional on the analytical completeness, species basis, temperature and database suitability supplied to it.
| Result field | Mandatory entry | Reason | Red flag |
|---|---|---|---|
| Analyte and reported form | Exact species or element and basis, such as NO₃, N, SO₄, S or mg/L as CaCO₃. | Prevents stoichiometric and unit-conversion errors. | A spreadsheet header that says only “nitrate” or “alkalinity”. |
| Fraction / preparation | Unfiltered, filtered pore size, dissolved, total or total recoverable; digestion/extraction. | Defines what material is included. | Comparing filtered and total results as if identical. |
| Method and revision | Published method, revision, laboratory SOP relationship and deviations. | Establishes analytical definition and applicability. | A generic instrument name without the method. |
| Units and basis | mg/L, mg/kg, molality, activity, dry/wet basis, temperature and density where needed. | Enables consistent mass and ionic balances. | Assuming mg/L equals ppm by mass in a dense brine. |
| Dilution / range | Dilution factor, calibration range and rerun history. | Reveals loss of sensitivity and matrix handling. | Trace analyte reported near a limit after extreme dilution. |
| Reporting limit and qualifiers | MDL/LLOQ or project reporting limit, non-detect convention and data flags. | Separates detection from usable quantitation. | Treating a non-detect as zero. |
| QC outcome | Blank, spike/recovery, duplicate, reference material and interference note as applicable. | Tests method performance in the sample matrix. | Accepting a number despite failed recovery or contaminated blank. |
Table 6.7. Minimum metadata required for an analytical result to enter the design basis.
6.9 The design-ready data request
The table below is the minimum request structure for a high-salinity wastewater project. It is intentionally broader than a laboratory quotation because the design basis must connect flow, chemistry, operation and required outcomes. Site-specific modules should be added only where a credible pathway or decision requires them.
| Data domain | Minimum request | Required operating cases | Deliverable / check |
|---|---|---|---|
| Stream and boundary | Named source unit, sampling point, upstream additions, downstream blends, current destination and system boundary. | Normal, design, upset and non-routine route. | Stream register and marked process-flow diagram. |
| Flow and timing | Average/min/max, batch volume/duration/frequency, production campaigns, cleaning, regeneration, storage and recycle. | Normal production, peak campaign, shutdown/start-up, CIP and upset. | Time series or event ledger; annual and design mass loads. |
| Field properties | pH, temperature, conductivity, ORP/DO and gases where relevant. | At source and expected treatment condition. | Calibrated field record with timestamp and operating state. |
| Bulk physical | TDS, TSS, turbidity/particle size, density, alkalinity and inorganic carbon. | Normal and solids-rich / concentrated events. | Method-qualified values and physical-property table. |
| Major ions | Na, K, Ca, Mg, Cl, SO₄, carbon system and site-relevant N/P/F/Br species. | Normal, design and limiting chemistry cases. | Charge-balance and ion-load table. |
| Scale / fouling species | Ba, Sr, silica, Fe, Al, phosphate, fluoride and site-specific constraints. | Highest credible concentration and relevant pH/temperature. | Speciation/saturation input set and uncertainty flags. |
| Organics / oil / biology | TOC/COD/BOD, oil fractions, VOC/SVOC, microbiology or toxicity where relevant. | Production-specific and cleaning/upset events. | Pretreatment and carryover risk table. |
| Metals / persistent / radioactive | Targeted list based on source pathway, permit, geology, product and waste route. | Worst credible source and concentration state. | Regulatory/product screening table and method limits. |
| Process chemicals | All routine and episodic chemicals, active ingredients, dose, location, timing and residual. | Minimum/maximum dose, cleaning and upset response. | Chemical mass ledger and compatibility notes. |
| Analytical metadata | Method, revision, fraction, preparation, units, dilution, reporting limit, qualifiers and QC. | For every result accepted into the model. | Validated analytical register; rejected or conditional data identified. |
| Required outputs | Reuse-water specification, discharge/disposal constraints, solids route and any recovered-product specification. | Normal and downside operation. | Decision criteria against which the data will be screened. |
Table 6.8. Design-ready data request table for high-salinity industrial wastewater.
Acceptance gate before technology screeningThe stream may enter technology screening only when its boundary and operating cases are named; flow and concentration can be converted to loads; major ionic and non-salt constraints are represented; additives and episodic events are documented; analytical methods and units are traceable; and the required water, residual and product outcomes are defined. Missing information remains an explicit uncertainty or test requirement. |
|---|
6.10 Handover to variability, sampling and data quality
Chapter 6 defines the variables that must exist in the design basis. It does not declare one sample representative. The next chapter establishes the sampling timeline, grab and composite strategy, event coverage, preservation, charge-balance and conductivity/density/TDS cross-checks, uncertainty treatment and the construction of normal, design and worst-case compositions.
The practical handover is a sampling and analysis plan linked to the stream register and operating-state matrix. Every requested parameter should have a reason, an applicable method, a target reporting limit and a decision rule for what happens when the matrix prevents reliable measurement.
6.11 Chapter conclusion
Wastewater characterization is the engineering definition of the feed. It combines average, minimum, maximum and batch hydraulics with production and cleaning cycles; field and bulk properties; major ions and scale-forming species; organics, oil, solids and biology; site-specific metals, radionuclides and persistent substances; and every process additive capable of changing the wastewater.
TDS remains one useful descriptor, but it cannot establish ionic strength, speciation, scaling sequence, fouling, corrosion, toxicity, product purity or analytical completeness. Results must preserve their method, unit, fraction, dilution, reporting limit and matrix-performance information. Cross-checks can reveal missing or inconsistent data, but they cannot justify inventing an ion or smoothing an uncertain result.
Once the required variables and operating states are defined, the project can design a representative sampling and quality-control programme. That is the subject of Chapter 7.
Chapter 6 in one sentenceA design-ready wastewater is not a TDS value; it is a named operating stream with traceable hydraulics, chemistry, process history, analytical basis and required outcomes. |
|---|