
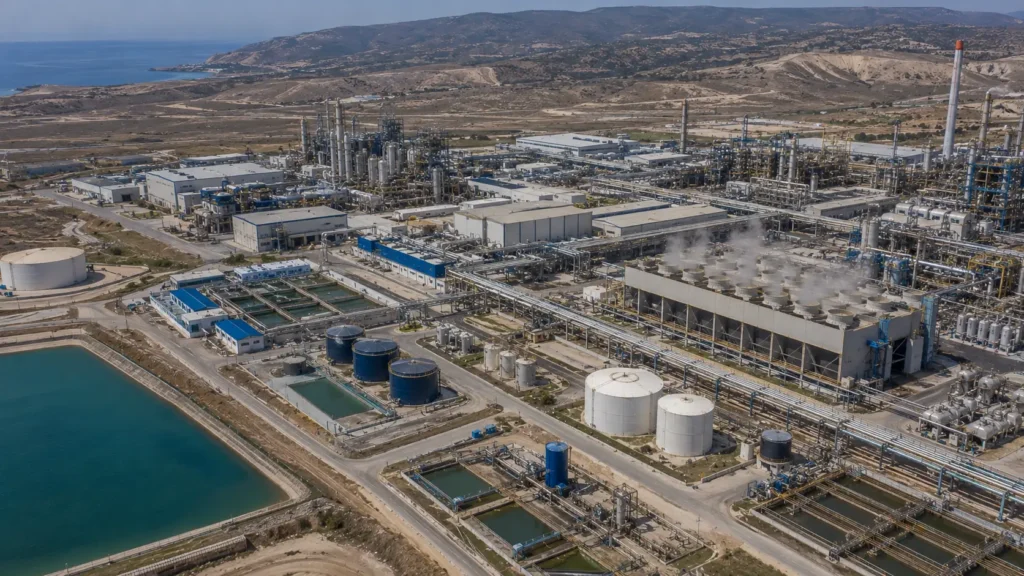
Map the whole facility before designing the final brine plant.
| Purpose | Chapter promise | Controlling anchor |
|---|---|---|
| Prevent end-of-pipe overdesign. | Enable the reader to define the site boundary, close a water balance, reveal hidden losses and recycles, separate clean and contaminated streams, and identify source-reduction and reuse actions before sizing a brine-treatment system. | The cheapest stream is often the one not sent to the brine plant. |
Controlled principleThe whole-site water balance is the first process-design document. It must track every external input, internal reuse, product incorporation, evaporation loss, wastewater stream, concentrate, sludge moisture, off-site transfer and storage change over a stated period. Internal recycle improves efficiency but is not new water and must not be double counted. |
|---|
5.1 Define the boundary before counting water
A request to treat “the brine” often begins too late in the system. The apparent end-of-pipe flow may combine avoidable leaks, clean cooling water, batch cleaning waste, high-salinity process purges, stormwater, regenerant and existing treatment residuals. Designing one central plant around that mixture can increase hydraulic capacity, pretreatment demand, energy use and residual complexity before the source problem has been tested.
The balance therefore starts with a declared physical and accounting boundary: the whole facility, one production area, one utility system or one campaign. It also needs a reporting period. A daily balance may expose batch cleaning and shift changes; a monthly balance may reveal production campaigns and seasonal cooling; an annual balance supports reporting but can hide the peaks that size equipment. The same boundary and period must be used for every input, output and storage term.
EPA describes a facility water balance as a chart, table or diagram that tracks water into and out of each process, including evaporation, product incorporation and wastewater discharge, and checks estimated or measured end uses against incoming metered supply. DOE’s Water Balance Tool follows the same discipline by comparing end-use consumption with total supplied water.
5.2 Build the balance from the outside in
Begin with external sources because they establish the independent control total. These may include third-party supply, surface water, groundwater, seawater, produced water, imported reclaimed water, collected rainwater and water arriving in wet raw materials. Each source needs a meter or defensible estimate, quality category, operating limit, cost and reliability basis.
Next map the major end uses: product and process contact, washing and rinsing, cooling, steam and boilers, air-pollution control, laboratories, domestic use, landscape irrigation and other auxiliary systems. EPA and DOE both emphasize source metering and submetering because process-level data makes it possible to compare the sum of end uses with the master meter and identify leaks, malfunction or missing streams.
Finally account for every external output and retained inventory: water incorporated into product, evaporated or vented water, routine discharge, trucked or piped off-site wastewater, brine or concentrate, sludge and solid moisture, uncontrolled loss and the change in tanks, ponds, tailings, heaps or reservoirs. GRI 303 uses withdrawal, discharge, consumption and storage change as reporting categories; an engineering balance uses the same external logic but normally requires a more detailed process ledger.
| Ledger group | Streams to name | Minimum quantity basis | Quality / constraint | Independent check |
|---|---|---|---|---|
| External inputs | Third-party, surface, groundwater, seawater, produced water, imported reclaimed water, rainwater, water in raw materials. | Average, design and peak flow or batch volume; operating days. | Source quality, treatment already applied, allocation and reliability. | Invoice/master meter, abstraction meter, tank receipt, raw-material moisture. |
| Internal transfers | Direct reuse, treated reuse, condensate return, cooling and boiler recirculation, filtrate return, wash recycle. | Flow and frequency at the transfer point. | Fit-for-purpose quality and accumulating species. | Upstream and downstream submeters; tank-level change. |
| Water uses | Production, product contact, washing, cooling, steam, scrubbers, labs, domestic and auxiliary use. | Continuous flow, cycle volume, duration, campaign and occupancy. | Required water quality, temperature and contamination picked up. | Equipment data, portable metering, production records. |
| External outputs | Discharge, sewer, off-site transfer, product incorporation, evaporation, brine, sludge moisture and leaks. | Flow or mass converted to water volume over the same period. | Destination, permit, product moisture, residual classification. | Outfall meter, manifest, product mass/moisture, blowdown estimate. |
| Storage change | Tanks, ponds, reservoirs, tailings, heaps, sumps and wet solids inventory. | Opening and closing inventory on the same timestamp basis. | Quality stratification, density and inaccessible inventory. | Level-volume curve, survey, density and operating log. |
Table 5.1. Whole-site water ledger: every stream needs a quantity, quality, period and independent check.
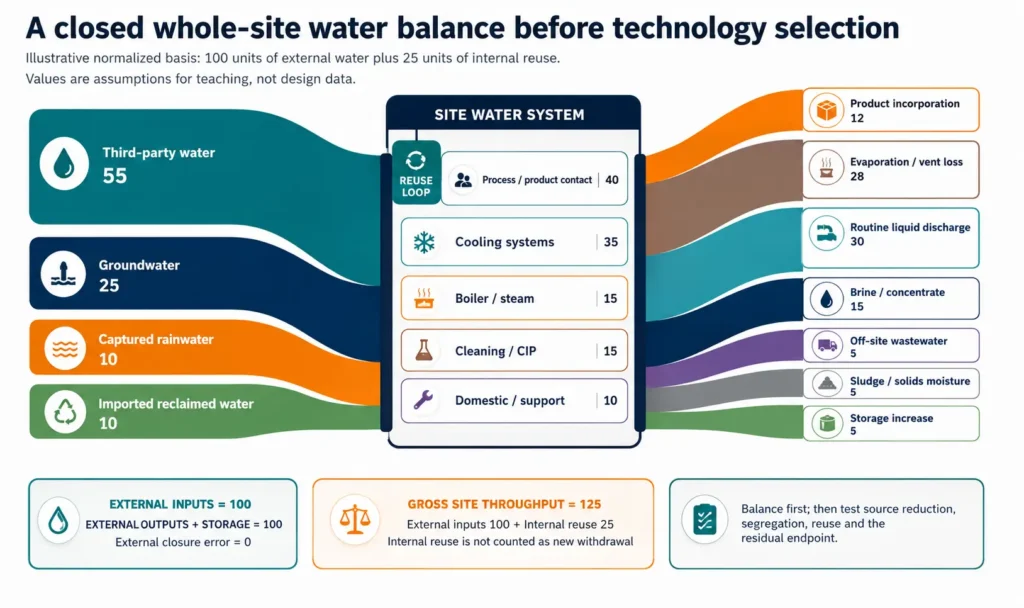
Figure 5.1. Illustrative normalized whole-site water balance. The example closes externally at 100 units and shows 25 units of internal reuse without counting it as new withdrawal.
5.3 Close the balance before interpreting it
For the whole-site external boundary, internal recycle cancels. A practical closure equation is: external inputs + opening storage = external outputs + closing storage + closure error. The error must not be hidden inside a generic “losses” line. It should be assigned to measurement uncertainty, unmetered flow, evaporation, product moisture, rainfall/runoff, leakage, inventory change or an incorrect boundary.
At process level, the ledger becomes more detailed: feed plus internal recycle must equal product water, wastewater, product incorporation, evaporation, solids moisture, purge and storage change. Chemical reactions can create or consume water, and density becomes important for concentrated solutions. Later chapters will close ionic and salt balances in addition to the water balance.
| Balance level | Required equation | What commonly breaks closure | Required response |
|---|---|---|---|
| Whole facility | External inputs + opening storage = external outputs + closing storage + error. | Unmetered wells, stormwater, evaporation, product moisture, tank inventory and trucked waste. | Name each missing term; do not force closure by adjusting the largest stream. |
| Process unit | Feed + recycle = water products + liquid residuals + evaporation + product/solid moisture + storage change. | Batch carryover, drains, hose use, seal water, sampling, vent condensate and intermittent purge. | Observe a complete cycle and reconcile continuous and batch data. |
| Treatment system | Feed = recovered water + concentrate + sludge moisture + cleaning waste + losses + storage change. | CIP, backwash, antiscalant dilution, solids entrainment, off-spec water and downtime. | Use the same availability and campaign basis as the design case. |
| Reporting boundary | Withdrawal = discharge + consumption, with storage disclosed where material. | Different site boundaries, reporting periods and definitions of reused water. | Keep reporting metrics separate from process recovery and volume-reduction metrics. |
Table 5.2. Closure rules for facility, process, treatment and reporting balances.
5.4 Internal reuse is a loop, not a new source
A site can circulate more water through its processes than it withdraws from outside. That is the point of reuse, but it creates a common accounting error: counting reused water as both a reduction in withdrawal and a new source without retaining the original external boundary. Gross process throughput and external withdrawal are different metrics.
Each reuse loop should name the donor stream, receiving use, treatment or conditioning step, flow, quality limits, storage, return ratio and purge. The receiving process sets the required quality. Potable or high-purity water should not be used where reclaimed, rain, seawater or lower-quality process water is fit for purpose. ISO 46001 frames water efficiency around reduce, replace and reuse, with monitoring and leak detection as supporting controls.
Reuse also changes chemistry. Non-volatile salts, organics and treatment additives can accumulate even when the hydraulic balance looks attractive. Every loop therefore requires a contaminant balance and a deliberate purge or removal mechanism. “Closed loop” is not a valid design statement unless accumulation and non-routine drains are quantified.
5.5 Segregate before treating
The water balance should preserve stream identity long enough to test segregation. A clean but warm cooling stream, a dilute biodegradable wash water, a high-salt mother liquor, an oily drain and a regenerant waste may have no rational common treatment objective. Blending can destroy direct-reuse options, dilute recoverable material and transfer one difficult contaminant into the entire flow.
| Segregation question | Keep separate when… | Potential benefit | New residual or control | Proof required |
|---|---|---|---|---|
| Clean versus contaminated | One stream meets a reuse or discharge condition before blending. | Avoid unnecessary treatment volume and preserve direct reuse. | Dedicated collection, monitoring and diversion during upset. | Normal and upset quality; cross-connection control. |
| Low-salt versus high-salt | A small stream carries most of the dissolved load. | Smaller brine plant and clearer concentration strategy. | Separate tank, campaign logistics or batch treatment. | Flow-weighted salt load and variability. |
| Organic versus inorganic | Biodegradable water is being mixed with toxic, solvent, oily or hypersaline waste. | Protect biological treatment and downstream product quality. | Dedicated pretreatment or off-site route. | COD/TOC, biodegradability, toxicity, oil and solvent profile. |
| Hot versus cold | A hot stream has heat-recovery value or changes scaling and treatment limits. | Recover heat and avoid oversizing cooling. | Heat exchanger fouling and materials control. | Temperature profile, duty and pinch/heat-use opportunity. |
| Batch versus continuous | Campaign or CIP peaks control design but occupy limited time. | Equalize or schedule rather than size every unit for coincidence. | Storage, compatibility and controlled release. | Cycle volume, duration, sequence and maximum simultaneous event. |
| Product-rich versus waste | One stream contains recoverable product or high-value reagent. | Prevent product loss and reduce downstream load. | Qualification, contamination control and off-spec fallback. | Mass inventory, purity, buyer or internal user. |
Table 5.3. Stream-segregation screen before central wastewater or brine treatment.
5.6 Reduce and reuse before concentrating the residual
The cheapest stream is often the one not sent to the brine plant. The balance should convert every major end use into an opportunity question: can the demand be eliminated, can a leak or overflow be stopped, can the required quality be reduced, can water be cascaded to a less demanding use, can a batch be segregated, or can treatment recover water without creating a worse residual?
EPA’s Lean and Water guidance uses water balances and value-stream mapping to identify the largest sources of water waste and a table that matches the quantity and quality of potential donor and receiving streams. IFC’s water-conservation guidance likewise supports monitoring, process-water reuse and optimization rather than defaulting immediately to end-of-pipe treatment.
| Priority | Question | Typical action | Why it precedes MLD/ZLD |
|---|---|---|---|
| 1. Eliminate | Is the use necessary at all? | Repair leaks; stop overflow; remove once-through use; optimize cleaning and rinse control. | Reduces both feed water and wastewater with minimal new residual. |
| 2. Segregate | Can a clean, concentrated or incompatible stream remain separate? | Dedicated drainage, campaign tanks and upset diversion. | Avoids treating clean water and prevents cross-contamination. |
| 3. Replace quality | Does the use require the current water quality? | Use reclaimed water, rainwater, seawater or lower-grade process water where fit for purpose. | Preserves high-quality supply and may avoid unnecessary treatment. |
| 4. Direct reuse / cascade | Can one stream meet another use without treatment? | Counter-current rinsing, condensate return, final-rinse to first-rinse reuse. | Captures value before adding treatment complexity. |
| 5. Treat for reuse | Can a defined treatment make a donor stream fit for a receiving process? | Filtration, softening, membranes, biological or selective removal as required. | Targets the receiving specification, not maximum theoretical recovery. |
| 6. Minimize residual | What stable liquid residual is economically and operationally manageable? | Selective removal and membrane/electrochemical concentration where chemistry permits. | Defines the MLD optimum before the final thermal increment. |
| 7. Eliminate routine liquid | Is no routine liquid route available or justified? | Evaporation and crystallization with complete solids, purge and cleaning-waste management. | ZLD is the endpoint after upstream demand and load have been reduced. |
Table 5.4. Opportunity hierarchy: reduce, segregate and reuse before sizing the residual-treatment train.
5.7 Average flow is not the design basis
A balance must show normal, design and upset conditions. Annual averages hide cleaning events, production campaigns, start-up and shutdown, weather, irrigation, seasonal cooling, batch dumps, regeneration, membrane cleaning, rainfall and maintenance. These events may not coincide, and a design based on their simple sum can be as misleading as a design based only on the average.
The preferred record is time-aligned: source meters, process submeters, tank levels, production rate, shift, temperature, rainfall, cleaning log and discharge flow on the same clock. A time series reveals base load, production-dependent load, seasonal load, unexplained night flow and event-driven peaks. EPA notes that regular monitoring can reveal peak periods and abnormal variation; DOE provides tools for analyzing metered water data and comparing end uses with total supply.
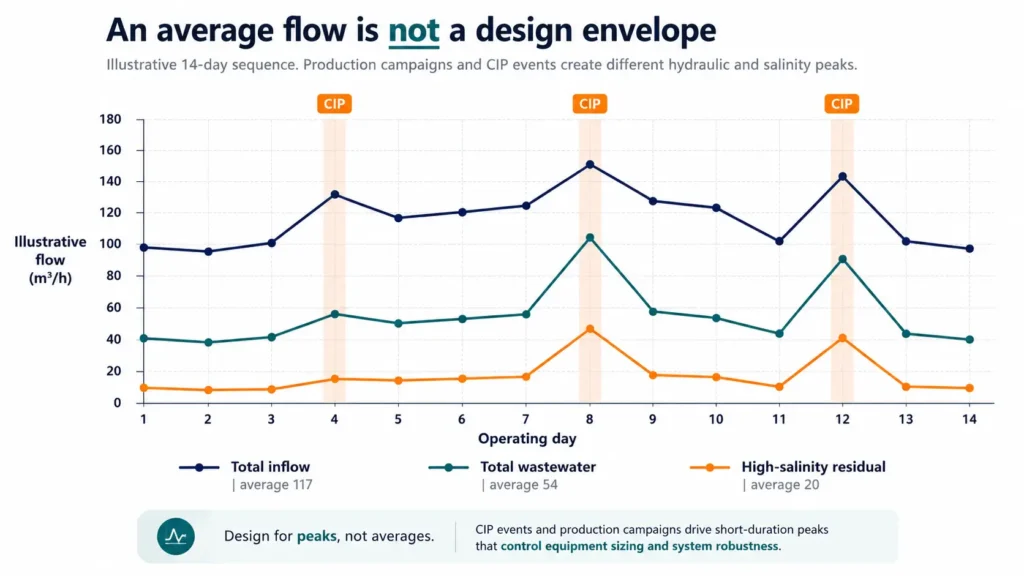
Figure 5.2. Illustrative time series showing why average intake, wastewater and high-salinity flow do not define batch or CIP design peaks. Values are synthetic assumptions.
| Operating state | Flow basis | Chemistry basis | Duration / frequency | Design implication |
|---|---|---|---|---|
| Normal production | Median and representative steady-state flow by campaign or product. | Representative composite chemistry with temperature and additives. | Hours per day and operating days per year. | Base equipment duty and normal control range. |
| Design production | Credible high sustained flow, not the theoretical sum of all maxima. | Design concentrations and ionic loads for the same production state. | Required sustained period. | Hydraulic and chemical design point. |
| Batch / cleaning | Cycle volume, instantaneous rate and receiving-tank release rate. | CIP reagents, pH, temperature, solvents, product and rinse sequence. | Cycle duration, frequency and maximum coincidence. | Equalization, segregation, neutralization and material selection. |
| Seasonal / weather | Cooling, irrigation, rainfall ingress and evaporation profile. | Temperature, source quality and concentration changes. | Monthly or wet/dry-season basis. | Seasonal capacity, storage and discharge constraints. |
| Upset / maintenance | Leak, drain-down, bypass, off-spec water and emergency inventory. | Worst credible contamination rather than average TDS. | Event duration, detection and recovery time. | Diversion, storage, off-site fallback and restart procedure. |
Table 5.5. Normal, design, batch, seasonal and upset bases must be internally consistent.
5.8 Meter what changes the decision
A balance does not require a permanent meter on every hose before it can begin. It does require a transparent hierarchy of evidence. Use calibrated fixed meters for control totals and critical continuous streams; temporary ultrasonic or insertion meters for surveys; batch volume and tank-level changes for intermittent streams; equipment-cycle calculations where direct measurement is impractical; and engineering estimates only where uncertainty is stated.
Submetering should be prioritized where a stream is large, variable, expensive, chemically controlling, legally relevant or decisive for reuse and segregation. A closure error larger than the expected measurement uncertainty is a finding, not an inconvenience. The balance should carry a confidence rating and an action to improve weak data before the next design stage.
| Evidence class | Typical method | Best use | Main limitation | Required record |
|---|---|---|---|---|
| A – Direct continuous | Calibrated master or submeter with historian. | Control totals, continuous process and discharge streams. | Drift, rangeability, zero flow and data gaps. | Tag, unit, calibration, interval, uptime and data-quality flag. |
| B – Direct campaign / portable | Temporary clamp-on meter, weigh tank, tote or batch total. | Campaigns, surveys and validation of estimates. | Short duration may miss variability. | Exact operating state, location, duration and uncertainty. |
| C – Inventory change | Tank level-volume curve, pond survey or mass difference. | Batch transfer and storage change. | Geometry, density, stratification and timing. | Opening/closing timestamp, level, density and transfers. |
| D – Calculated | Cycle volume x cycles; steam balance; cooling evaporation/blowdown relation. | Well-defined equipment or cycle when inputs are measured. | Assumptions and correlated errors. | Formula, source data, period and sensitivity. |
| E – Engineering estimate | Operator log, pump curve, hose timing or analogous data. | Initial screening and gap identification. | Low confidence and bias. | Range, basis, owner and plan for verification. |
Table 5.6. Measurement hierarchy and minimum data-quality record.
5.9 What the completed balance must decide
The water balance is complete only when it changes the project. It should identify the true high-salinity load by source, the streams that should never be blended, the clean or warm streams that can be reused, the unmeasured flows that require verification, the storage needed for batch and upset events, and the reduced design feed that remains after source actions.
The final output is not merely a Sankey diagram. It is a controlled hydraulic basis for Chapter 6 characterization: named streams, average/design/peak and batch flows, operating periods, sampling points, production and cleaning context, source and destination, measurement confidence and outstanding closure error. Technology screening begins only after that basis exists.
| Balance output | Decision enabled | Handover to later chapters |
|---|---|---|
| Source and end-use ledger | Where water enters, adds value and becomes contaminated. | Sampling plan and design-ready stream names. |
| External and process closure | Whether the baseline is complete enough for calculation. | Water and salt balance confidence; missing-data actions. |
| Segregation map | Which streams should remain separate in normal and upset operation. | Pretreatment blocks, storage and residual routes. |
| Reuse match | Which donor streams can meet which receiving uses and at what quality. | Product-water specifications and recovery objectives. |
| Variability envelope | What normal, design, batch, seasonal and upset cases exist. | Equipment capacity, equalization and pilot test matrix. |
| Reduced residual basis | What feed remains after source reduction and internal reuse. | MLD/ZLD endpoint and technology screening basis. |
Table 5.7. Required decision outputs from the whole-site water balance.
Decision disciplineDo not size the brine plant from the current combined outfall until the site has quantified its sources, uses, losses, recycles, products, discharges, residuals and storage. Reduce the hydraulic flow and contaminant load at source, preserve useful segregation, and then define the remaining treatment feed. |
|---|
5.10 Chapter conclusion
The whole-site water balance prevents an avoidable plant-wide mixture from becoming the design feed. It starts with a declared boundary and period, closes external inputs against product incorporation, evaporation, discharge, residuals and storage, and then maps internal use and reuse without double counting.
The balance also exposes decisions that an equipment list cannot: clean streams being contaminated by collection, small streams carrying most of the salt load, batch events controlling storage rather than treatment capacity, reuse loops accumulating non-volatile species, and apparently missing water that is actually in product, vapour, sludge or inventory.
The cheapest and most reliable reduction is often achieved before the brine plant through elimination, segregation, quality matching and internal reuse. Chapter 6 therefore begins with the reduced, named streams and defines the analytical and operating data required to characterize them.
Chapter 5 in one sentenceMap and close the whole-site water system first, because the best brine-treatment feed is the smaller, cleaner and better-defined residual that remains after source reduction, segregation and reuse. |
|---|