
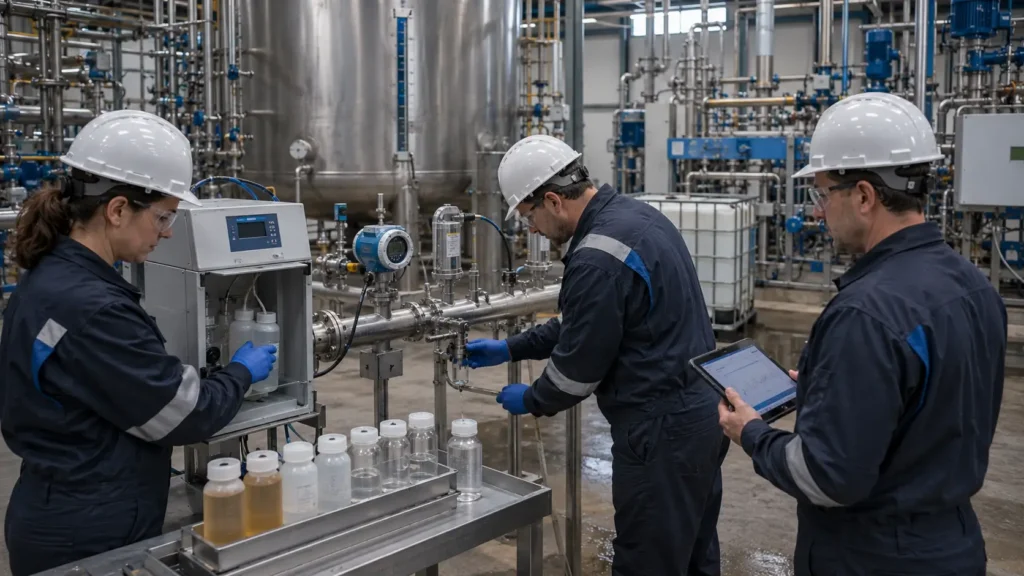
Connect the normal, design and worst-credible chemistry cases to the mechanisms that limit recovery, uptime and materials.
Controlled principleScaling, fouling and corrosion are not three independent checkboxes. Concentration changes ion activities, pH, gas partitioning, viscosity, supersaturation, colloidal stability, organic interactions and electrochemical conditions. Deposits can become corrosion cells; corrosion products can become foulants; antiscalants and cleaning chemicals can create new organic or polymer burdens. |
|---|
8.1 Recovery changes more than concentration
Chapter 7 produced physically coherent normal, design, turndown and worst-credible compositions. Chapter 8 asks what happens when those waters are concentrated, heated, cooled, aerated, reduced, mixed, dosed and exposed to real surfaces. A retained conservative solute rises according to the water removed, but reactive species do not remain conservative. They can speciate, complex, precipitate, polymerize, adsorb, volatilize, oxidize or become incorporated into another solid.
The ideal concentration-factor curve is still useful because it shows why the final recovery increments deserve disproportionate scrutiny. Under the simple assumption of complete solute rejection and no reaction, 50% recovery doubles a retained solute, 75% recovery quadruples it, 90% recovery increases it tenfold and 95% recovery increases it twentyfold. Those values are a calculation, not a universal process limit. Real systems depart from the curve as soon as rejection, density, precipitation, purge, chemical addition, gas transfer or recycle changes the mass balance.
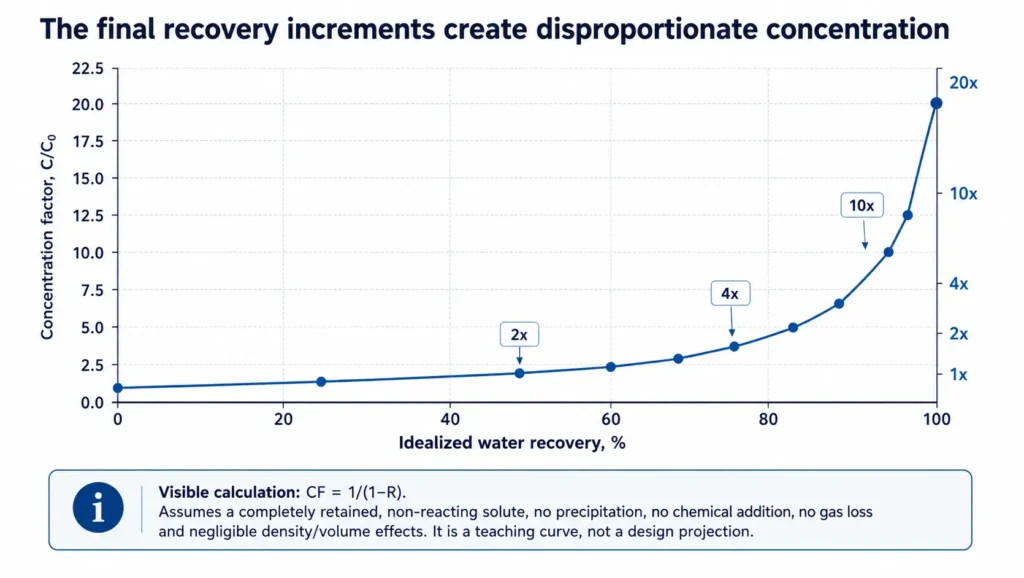
Figure 8.1. Ideal conservative-solute concentration factor versus water recovery. Assumptions are stated below the graph.
The engineering consequence is that risk does not necessarily increase smoothly. A stream can remain operationally stable through several recovery steps, then cross a saturation, polymerization, phase-change, foaming or localized-corrosion condition over a small additional increment. A different temperature, pH or chemical dose can move that transition earlier or later. Design must therefore model and test the path, not only compare the feed and final concentrate.
8.2 Scaling: thermodynamic potential is not deposition certainty
Mineral scale forms when a solution becomes supersaturated and the kinetic and transport conditions permit nucleation, growth and attachment. PHREEQC calculates aqueous speciation and saturation indices using a selected thermodynamic database and activity model. It can use ion-association, Pitzer or SIT formulations, but the result remains conditional on the input composition, temperature, redox state, phase set and suitability of the interaction parameters.
A positive saturation index indicates thermodynamic supersaturation for the modelled phase. It does not establish induction time, deposition rate, location, adhesion, crystal habit, inhibitor response or cleaning reversibility. Conversely, a low mineral saturation index does not rule out colloidal, organic, biological, polymer or corrosion-product deposition. The model should be paired with operating history, bench tests, coupon or membrane studies, deposit analysis and pilot evidence.
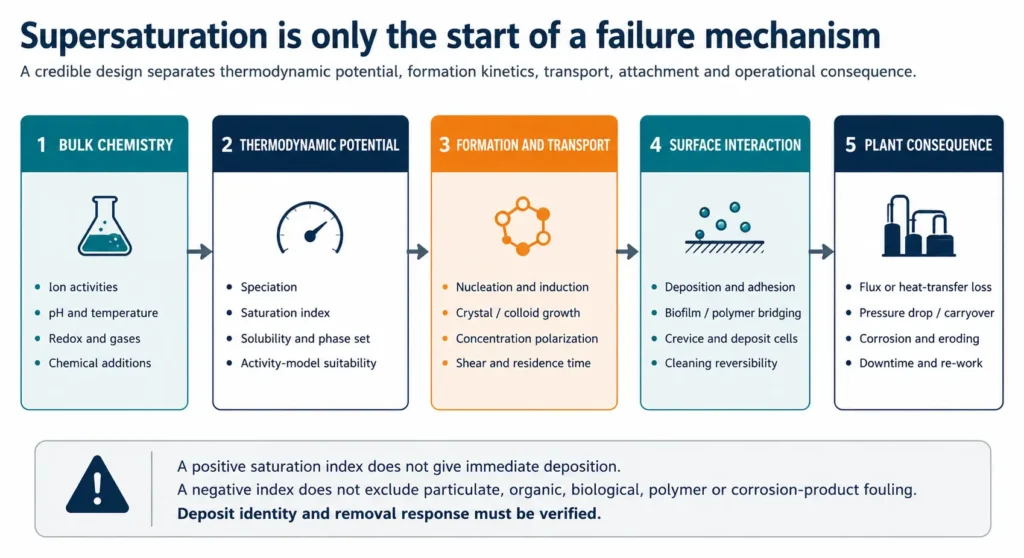
Figure 8.2. Failure analysis must separate supersaturation, kinetics, transport, attachment and operational consequence.
| Scale family | Controlling chemistry | Where risk changes | Evidence required | Common design error |
|---|---|---|---|---|
| Carbonate | Calcium or other cations, alkalinity/inorganic carbon, pH, temperature, CO₂ exchange and ionic activity. | Acid/base dosing, degassing, heating, concentration and mixing. | Carbonate-system analysis, model with stated activity basis, precipitation/seed tests and deposit identification. | Using a feed-water index unchanged through concentration or assuming alkalinity equals bicarbonate. |
| Sulfate | Ca, Ba, Sr and sulfate activities; common-ion effects, temperature and competing solids. | High-rejection concentration, blending, softening leakage and chemical additions. | Sulfate-salt calculations, thermodynamic screening, induction tests and solids analysis. | Treating gypsum, barite and celestite as one interchangeable limit. |
| Silica / silicate | Molecular silica, pH, temperature, Mg/Ca/Al/Fe, colloids, surface charge and residence time. | High recovery, pH shift, cation carryover, cooling and long storage. | Dissolved/colloidal fractions, time-dependent tests, surface/deposit analysis and matrix-specific modelling. | Applying one universal silica concentration limit or ignoring cation-mediated silicate formation. |
| Hydroxide / metal | pH, metal inventory, oxidation state, ligand/chelating chemistry and carbonate competition. | Caustic softening, neutralization, aeration and oxidation. | Full metals basis, redox/pH path, precipitation and dewatering tests. | Counting metal removal without sludge volume, carryover or resolubilization. |
| Fluoride / phosphate | Ca and other cations, fluoride/phosphate species, pH and competing carbonate/hydroxide phases. | pH adjustment, concentration and reagent contamination. | Species basis, targeted saturation screening and solids characterization. | Omitting F/P because their mass is small even when their phase is sparingly soluble. |
| Mixed deposits | Simultaneous mineral, silica, metal hydroxide, organic, polymer and biofilm interactions. | Any recycle, antiscalant, coagulant carryover or sequential pH/temperature change. | Autopsy, microscopy/spectroscopy/mineralogy and cleaning response. | Naming a deposit from one element or one saturation index. |
Table 8.1. Major scale families and the evidence required before assigning a recovery limit.
8.3 Carbonate, sulfate and silica do not behave as one scale problem
Carbonate risk is strongly coupled to the carbonate system. Acid addition can reduce carbonate supersaturation by shifting alkalinity species and retaining carbon as dissolved CO₂, while degassing or heating can move the system in the opposite direction. The location of dosing, gas transfer and residence time therefore matters. A calcite saturation index calculated for a sealed laboratory bottle may not represent an aerated tank, membrane channel or hot evaporator.
Sulfate scales require separate treatment by phase. ASTM D4692 provides a current standard practice for calculating and adjusting calcium, strontium and barium sulfate scaling potential for RO and NF concentrate streams, reinforcing that the calculation must use the feed analysis and operating conditions. It does not replace site-specific kinetics, inhibitor testing or verification of the actual solid.
Silica is particularly sensitive to matrix and history. An open 2022 study found that divalent-cation concentration materially changed silica behaviour in an RO concentrate and demonstrated that a commonly used operating limit was not universal for the tested matrix. Separate high-recovery studies have shown aluminosilicate and iron-rich mixed deposits, while recent controlled experiments found that silica can either aggravate its own deposition or modify calcium-mineral growth. These are system-specific mechanisms, not reasons to assume silica always worsens—or always suppresses—another scale.
The design rule is therefore selective: identify the species that constrains the next step and remove or control it before increasing concentration. Bulk softening, targeted precipitation, pH conditioning, antiscalant use, seed crystallization, intermediate solids separation and shorter residence time can each be valid in the right chemistry. None is a universal front end.
8.4 Fouling: material can accumulate without mineral precipitation
Fouling covers suspended particles, colloids, corrosion products, oil, organics, biological material and process polymers. These materials can deposit as a cake layer, adsorb to a surface, bridge particles, block spacers or channels, wet a hydrophobic surface, form a biofilm, stabilize an emulsion or become incorporated into mineral scale. The same foulant can be reversible in one hydraulic regime and strongly adhesive in another.
DuPont’s current FilmTec technical manual treats scale control, colloidal/particulate fouling, biological fouling and cleaning as separate design and operating topics. It identifies calcium carbonate, sulfate salts, calcium fluoride, silica and calcium phosphate as distinct scaling calculations and separately addresses colloidal, particulate and biological fouling. This separation is useful because a low mineral scaling projection does not establish a low fouling risk.
A controlled 2016 study of wastewater-reuse pretreatment showed that suspended solids, colloids, organics and bacteria can combine to create RO fouling and that pretreatment sequence changed cleaning reversibility. The transferable lesson is not the specific train; it is that foulant interactions and reversibility must be tested with the actual matrix.
| Fouling family | Typical source | Diagnostic signals | Design controls to test | Residual / downside |
|---|---|---|---|---|
| Suspended / settleable | Process solids, precipitates, corrosion products, biomass, poor tank mixing. | TSS/turbidity/particle size, pressure drop, settling and deposit mass. | Segregation, clarification, filtration, equalization, velocity and solids withdrawal. | Backwash, sludge, filter waste and abrasion. |
| Colloidal | Clays, fine oxides/hydroxides, silica/aluminosilicates, destabilized emulsions. | SDI or other bounded tests, zeta/particle data, microscopy, pressure-drop and flux response. | Coagulation, MF/UF, chemistry control, mixing and compatibility testing. | Coagulant/polymer carryover and difficult dewatering. |
| Oil / emulsion | Produced water, refinery, machining, food fats and surfactant-stabilized streams. | Oil fractions, droplet size, surface tension, TOC and membrane/evaporator observations. | Source removal, flotation, coalescence, media, oxidation or dedicated organic treatment. | Oily sludge, spent media, wetting, foaming and condensate contamination. |
| Organic | Natural organic matter, product loss, solvents, surfactants, antifoams and degradation products. | TOC/COD, LC/GC targets, fluorescence or size fractions, cleaning response. | Adsorption, oxidation, biological pretreatment, low-flux design and compatible cleaning. | Spent carbon/media, oxidation by-products and cleaning waste. |
| Biological | Nutrients, assimilable carbon, warm storage, dead legs and inadequate control. | ATP/culture/activity, pressure drop, biofilm inspection and differential response. | Nutrient/source control, hydraulics, biocide strategy, sanitization and pretreatment. | Biomass, biocide residuals and rapid regrowth if the source remains. |
| Polymer / additive | Antiscalants, flocculants, coagulants, thickeners, extraction chemicals and CIP residues. | Chemical ledger, molecular/elemental fingerprint, sticky deposits and cleaning incompatibility. | Dose optimization, segregation, compatibility testing and upstream removal. | Irreversible mixed deposits and misleading scale diagnosis. |
Table 8.2. Fouling families, diagnostics and the residual streams created by control measures.
8.5 Foaming, entrainment and condensate quality
Foaming is not simply an aesthetic operating issue. Stable foam can reduce usable vessel volume, disrupt level control, entrain droplets into vapour or gas systems, contaminate condensate, overload mist eliminators and increase chemical consumption. Oil, surfactants, proteins, biological material, fine solids and some polymers can become more surface-active as water is removed.
A Veolia produced-water evaporator case provides a bounded operational example: an oil upset far above the stated design basis caused foaming in the evaporator sump, while an integrated vapour-washing barrier protected the compressor and distillate quality. The case does not establish a universal oil threshold; it demonstrates why upset chemistry, vapour disengagement, entrainment control and condensate monitoring belong in the design basis.
Foam-control testing should record feed and concentrated-liquid behaviour, temperature, gas rate, mixing/shear, residence time, antifoam dose, vapour carryover and downstream product quality. Antifoam can solve one symptom while adding organics, silicone or solids to membranes, evaporators, crystals or recovered products. Its full material balance and product compatibility must be visible.
| Foaming question | Minimum test / data | Failure if ignored | Design response |
|---|---|---|---|
| What creates and stabilizes the foam? | Oil/emulsion, surfactant, protein, polymer, fine-solid and biological inventory by operating state. | Unexpected foam onset after concentration or chemical addition. | Source segregation, upstream removal and chemistry-specific testing. |
| Where can entrainment go? | Vapour path, separator efficiency, demister loading, compressor/condensate interface and vent routing. | Distillate/product contamination, corrosion or downstream fouling. | Vapour washing, disengagement, demisting, alarms and bypass/fallback. |
| Does antifoam remain compatible? | Dose-response, active chemistry, carryover, degradation, solids and product impact. | Membrane fouling, crystal contamination or off-spec product. | Approved chemistry, minimum effective dose and alternative mechanical control. |
| How is an upset detected? | Foam level, differential pressure, conductivity/TOC in condensate and visual/process alarms. | Loss of control before product contamination is recognized. | Independent monitoring and conservative upset storage/diversion. |
Table 8.3. Foaming and entrainment questions for evaporators and other gas-liquid systems.
8.6 Corrosion is a materials-and-environment interaction
Corrosion screening must name the material, fabrication condition, stress state, temperature, liquid composition, gas phase, velocity, deposits, cleaning exposures and electrochemical environment. A chloride concentration alone is not a materials specification. Passive alloys can suffer localized attack when the protective film is destabilized, while carbon steels and other alloys can be controlled by very different mechanisms.
AMPP describes pitting, crevice, galvanic and stress-corrosion mechanisms as distinct forms of corrosion. Chloride, acidity, oxygen availability and local occluded chemistry can destabilize passive films; dissimilar electrically connected materials in a conductive electrolyte can form a galvanic couple; and stress-corrosion cracking requires a susceptible material, tensile stress and a specific environment.
Nickel Institute guidance treats pitting and crevice resistance in chloride environments as testable alloy properties rather than a universal grade hierarchy. A 2025 AMPP research study further demonstrated the interaction of concentrated chloride, temperature and very low dissolved oxygen for 316L stainless steel: severe pitting and cracking appeared at the higher test temperature despite the low oxygen condition. That result is specific to concentrated ammonium chloride and must not be generalized to every brine, but it is a useful warning against treating deoxygenation as a complete corrosion guarantee.
| Corrosion variable | Why it matters | Where it changes in MLD/ZLD | Evidence required | Design response |
|---|---|---|---|---|
| Chloride / halides | Localized-film breakdown, crevice enrichment and SCC susceptibility for some alloys. | Concentration, evaporation, dry/wet interfaces, deposits and cleaning. | Full halide chemistry, temperature, alloy condition and relevant test/reference data. | Alloy/lining selection, crevice control, monitoring and bounded operating envelope. |
| Temperature | Changes kinetics, solubility, gas transfer, passive-film stability and SCC conditions. | Heat exchangers, evaporators, compressors, crystallizers and hot cleaning. | Metal and fluid temperature profiles, not only bulk average. | Materials selected for the hottest local condition and transient. |
| pH / acidity / alkalinity | Controls general attack, passivity, hydrogen evolution and deposit chemistry. | Acidification, caustic softening, neutralization and under-deposit cells. | Normal, cleaning and upset pH at material surfaces. | Compatible material, dosing control, mixing and isolation of extremes. |
| Oxygen and redox | Controls cathodic reactions, passivation, sulfide/iron state and microbial pathways. | Aerated tanks, deaeration, vents, dead legs, reducing chemicals and biofilms. | DO/ORP/redox species by location and transient. | Gas control, chemistry control and monitoring; avoid assuming one ORP describes the system. |
| Deposits / crevices | Create differential-aeration and aggressive occluded chemistry; shield surfaces from monitoring/cleaning. | Scale, sludge, gaskets, lap joints, stagnant zones and solids beds. | Deposit identity, geometry, velocity and under-deposit inspection. | Deposit prevention/removal, hygienic geometry, access and corrosion allowance/lining. |
| Materials / fabrication | Alloy composition, welds, heat treatment, cold work, residual stress and surface condition change susceptibility. | Fabrication, repair, welding, machining and chemical cleaning. | Material certificates, weld procedure, surface condition and service test data. | Materials engineer review; avoid selecting only by bulk chloride number. |
| Galvanic coupling | Dissimilar metals in electrical contact share a conductive electrolyte and change corrosion rates. | Pumps, fasteners, sensors, heat exchangers, linings and repair patches. | Material pairs, area ratio, electrical continuity and electrolyte exposure. | Isolation, compatible pair selection, coating strategy and cathodic/protection review. |
| Stress-corrosion cracking | Requires susceptible material, tensile stress and a specific chemical/temperature condition. | Weld residual stress, high-temperature chlorides, caustic or sulfide environments. | Alloy-specific literature/testing, stress state and full environment. | Alloy and fabrication control, stress relief where applicable and conservative transients. |
Table 8.4. Corrosion screening variables that must remain tied to material, location and operating state.
Under-deposit corrosion closes the loopScale and foulant control is also corrosion control. Deposits can produce crevices, differential aeration, local pH shifts and chemical concentration at a surface. Corrosion products then add iron, copper or other solids to membranes, heat exchangers and crystals. Deposit analysis and materials inspection should therefore be interpreted together. |
|---|
8.7 Risk map along concentration factor
The map below is deliberately qualitative. It answers a screening question: which failure mechanisms deserve stronger investigation as a design moves from a weakly concentrated stream toward a deep concentrate? It does not assign a universal recovery limit. Risk can appear at low concentration because of oil, biology, incompatible polymers or aggressive corrosion chemistry, and it can remain manageable at high concentration when the feed is selectively conditioned, surfaces are suitable and solids are deliberately controlled.
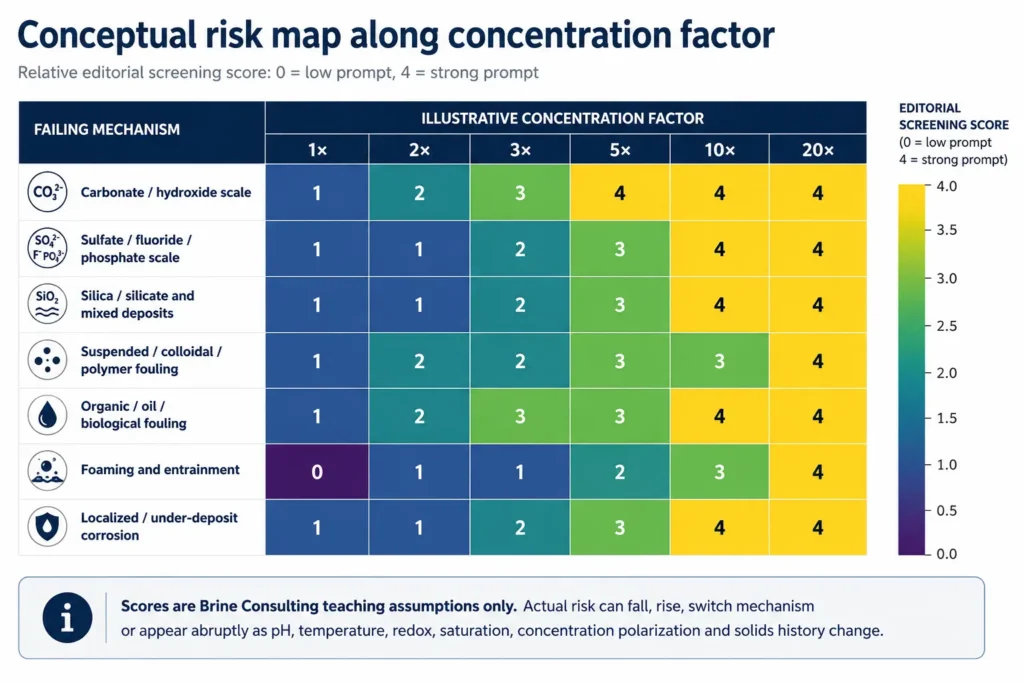
Figure 8.3. Conceptual risk map along concentration factor. Scores are editorial prompts, not measured probabilities.
| Concentration stage | Questions that become more important | Evidence to add | Gate before proceeding |
|---|---|---|---|
| Initial feed / low concentration | Are oil, solids, biology, corrosive gases or incompatible chemicals already controlling? | Representative state samples, field data, materials history and deposit/foulant evidence. | Do not mistake low mineral saturation for low total risk. |
| Moderate concentration | Which conservative ions rise, which reactions start, and where does concentration polarization exceed bulk conditions? | Speciation/saturation path, bench loop, antiscalant/pretreatment compatibility and hydraulic review. | Identify the first constraint and a credible control step. |
| Intermediate solids-control point | Can selective precipitation or separation remove the next constraint without creating worse carryover or sludge? | Reaction/settling/dewatering tests, filtrate chemistry, sludge mass and recycle impact. | Close the chemical and solids balance. |
| Deep concentrate / thermal feed | Do viscosity, boiling-point elevation, foaming, entrainment, mixed salts and corrosion become controlling? | Evaporation or crystallization tests, vapour/condensate data, materials review and purge logic. | Prove heat transfer, product quality, corrosion boundary and residual route. |
| Mother liquor / final purge | Which impurities no longer crystallize, what accumulates, and where does the purge go? | Time-dependent recycle model, mother-liquor analysis, washing/purity tests and disposal qualification. | No closed-loop claim without quantified purge and impurity control. |
Table 8.5. Evidence gates as concentration progresses from feed to mother liquor.
8.8 Diagnose the mechanism before prescribing the cleaning
A decline in flux, heat transfer or throughput does not identify the cause. Pressure-drop location, normalized performance, temperature, feed chemistry, production state, cleaning history and deposit location should be combined with autopsy or solids analysis. Mineralogy, elemental analysis, microscopy, organic spectroscopy, microbiology and corrosion inspection answer different questions.
Cleaning response is evidence but not proof. Acid removal suggests an acid-soluble fraction; alkaline or surfactant response suggests organic, biological or oil involvement; oxidant response may alter biology or organics; chelants can mobilize metals. Mixed deposits can respond sequentially, and aggressive cleaning can damage membranes, linings, gaskets or passive films. The cleaning protocol must follow the equipment supplier’s limits and the identified foulant.
| Observed symptom | Possible mechanisms | Discriminating evidence | Do not conclude from symptom alone |
|---|---|---|---|
| Rising pressure drop | Particulate cake, biofilm, polymer/oil, crystal deposition, spacer blockage or gas/foam effects. | Location by stage/channel, normalized data, solids/autopsy and event history. | That the problem is “scaling” because TDS is high. |
| Declining permeate or distillate rate | Osmotic increase, fouling/scale, temperature/viscosity, heat-transfer loss, wetting or equipment degradation. | Normalized flux/heat duty, pressure/temperature, chemistry and cleaning response. | That the membrane or heat exchanger is permanently damaged. |
| Product-quality deterioration | Membrane damage, wetting, vapour entrainment, volatile carryover, seal leakage or off-spec crystal washing. | Ion/organic fingerprint, integrity test, condensate monitoring and mechanical inspection. | That higher feed concentration alone caused the loss. |
| Frequent cleaning | Wrong pretreatment, operating above stable envelope, incompatible additives, biofilm source or incorrect cleaning sequence. | Trend by operating state, foulant identification and post-clean normalization. | That more frequent or stronger chemical cleaning is the solution. |
| Localized metal attack | Pitting, crevice, galvanic, under-deposit, erosion-corrosion or SCC. | Metallography, material/weld data, deposit chemistry, electrochemical/environment review. | That bulk corrosion coupon rate represents the localized mechanism. |
Table 8.6. Diagnostic matrix: symptoms do not uniquely identify scale, foulant or corrosion mechanism.
8.9 Prevention is an integrated operating strategy
The most reliable control strategy combines source segregation, hydraulic stability, selective constraint removal, compatible chemical dosing, deliberate solids separation, appropriate materials, monitoring and cleaning access. Antiscalant alone cannot compensate for an uncharacterized mixed feed. Alloy selection alone cannot compensate for stagnant crevices and deposits. A large cleaning system cannot compensate for a biofilm nutrient source that remains uncontrolled.
The prevention plan should identify each mechanism, leading indicator, control variable, alarm, action limit, contingency route and verification test. The action limit is site- and equipment-specific; this guide does not publish a universal saturation-index, SDI, chloride, silica, oxygen or corrosion threshold.
| Mechanism | Leading indicator | Primary control | Verification | Fallback / residual |
|---|---|---|---|---|
| Mineral scale | Speciation/saturation path, normalized performance and solids trend. | Selective removal, pH/temperature control, inhibitor/seed strategy and recovery limit. | Bench/pilot, deposit identity and cleaning recovery. | Intermediate blowdown, solids separation, lower recovery or alternative endpoint. |
| Particulate/colloidal fouling | TSS/turbidity/particle metrics and pressure-drop distribution. | Segregation, clarification, filtration and hydraulic control. | Filter/UF performance, autopsy and mass balance. | Backwash/sludge route and feed diversion. |
| Organic/oil/polymer fouling | TOC/oil/additive ledger, surface tension and cleaning response. | Source removal, compatible pretreatment, dose control and lower surface loading. | Target analysis and foulant fingerprint. | Spent media, oily sludge, segregated disposal or treatment. |
| Biofouling | Activity/nutrient indicators and pressure-drop trend. | Source/nutrient control, hydraulics, sanitization and monitoring. | Biofilm/activity tests and post-clean stability. | Shutdown, sanitization waste and root-cause correction. |
| Foaming/entrainment | Foam level, vapour differential, condensate conductivity/TOC. | Source removal, vapour separation and compatible antifoam. | Concentration/boiling test and condensate quality. | Diversion, reduced load, product quarantine and foam waste. |
| Corrosion | Material-specific inspection, chemistry and localized indicators. | Materials/fabrication, geometry, chemistry, deposit control and monitoring. | Coupons/probes where relevant, NDE, metallography and failure analysis. | Repair, isolation, lining/alloy upgrade and contaminated solids management. |
Table 8.7. Integrated prevention, verification and fallback plan.
Design acceptance gateBefore increasing recovery or advancing to the next concentration block, confirm that the normal, design and worst-credible cases have been modelled on a suitable activity basis; the limiting scale/foulant/corrosion mechanism is named; formation and deposition evidence exists; chemical and materials compatibility is checked; cleaning and monitoring are practical; and every sludge, cleaning waste, purge and off-spec product has a route. |
|---|
8.10 Handover to mass balances and recovery calculations
Chapter 8 identifies where chemistry can stop behaving as a conservative dissolved load. Chapter 9 converts that understanding into calculation language: feed, product and concentrate flows; stage and overall recovery; concentration factor; salt and product recovery; solid generation; chemical incorporation; purge; and closure error.
The handover is a reaction-aware stream table. It names which species remain dissolved, which precipitate, which enter sludge or product, which volatilize or carry over, which are added as reagents and which accumulate in recycle. A recovery calculation that ignores those transfers can close the water balance while failing the chemical and residual balance.
8.11 Chapter conclusion
Every recovery increment changes chemistry nonlinearly. The theoretical concentration factor rises steeply near the final recovery increments, while real reactive systems also change speciation, saturation, colloidal stability, organic interactions, gas transfer and electrochemical conditions. The next constraint may therefore appear abruptly and may not be the constraint predicted from feed TDS.
Scale potential must be separated from deposition kinetics and surface attachment. Carbonate, sulfate, silica/silicate, hydroxide, fluoride, phosphate and mixed deposits require different chemical and evidentiary treatment. Suspended, colloidal, oily, organic, biological and polymer foulants can dominate even where mineral saturation is low. Foaming can transfer feed contaminants into vapour and product systems. Corrosion must remain tied to material, fabrication, stress, deposits, chloride, temperature, pH, oxygen and redox.
The practical objective is not to eliminate every theoretical risk. It is to identify the first controlling mechanism, manage it with the lowest total system burden, verify the mechanism and preserve an operable fallback. Chapter 9 now closes the flows, salts, reactions, solids and purges created by that strategy.
Chapter 8 in one sentenceConcentration does not merely make the same water stronger; it changes phases, surfaces and electrochemical conditions, so each recovery increment must be tested against the next failure mechanism. |
|---|