

Build the decision from the counterfactual, complete life-cycle cost, defensible value and explicit downside.
Controlled principleA business case is not a vendor quotation plus a commodity-revenue estimate. It is a comparison of credible options against a defined counterfactual over one complete source-to-endpoint boundary, with every cost, benefit, residual and risk assigned once. |
|---|
Start with the counterfactual and the decision—not the equipment list
Chapter 27 handed forward a selected on-site, centralized or hybrid architecture, together with committed source conditions, transport duties, shared assets, product routes, residual ownership and downside cases. Chapter 28 converts that architecture into a decision model. The first line is not the proposed plant cost; it is the counterfactual: what happens if the owner continues with the current water, production and residual-management arrangement, or selects a lower-complexity alternative.
HM Treasury’s 2026 Green Book frames appraisal as a comparison of costs, benefits and risks across options and requires business as usual to remain as the benchmark. GAO cost guidance likewise requires the purpose, scope, schedule, technical baseline, work breakdown structure, assumptions, data and risk analysis to be explicit before a cost estimate can be considered reliable. Those principles transfer directly to industrial brine projects: the business case must compare at least the current baseline, the selected option and a credible lower-complexity alternative on the same physical and accounting boundary. [1,4,5]
| Case | Boundary and endpoint | Costs included | Value included | Failure if omitted |
|---|---|---|---|---|
| Business as usual / current baseline | Existing water supply, production constraint, treatment and final residual route. | Current purchase, treatment, discharge/haulage, downtime and liability costs. | Existing service value only. | Project benefits are overstated because the cost of doing nothing is undefined. |
| Lower-complexity alternative | Source reduction, reuse or MLD endpoint with named residual route. | Incremental assets, OPEX, residual and compliance costs. | Avoided water/disposal and operational value. | ZLD or valorization is selected without a credible comparator. |
| Selected project | Complete source-to-endpoint train, including utilities, solids, transport and fallback. | Total project CAPEX, life-cycle OPEX, replacements, start-up and residual capacity. | Qualified internal value, avoided costs and risk-adjusted product netback. | Vendor package is mistaken for a complete project. |
| Downside case | Same assets and obligations under adverse commercial/operating conditions. | Higher costs, lower availability, delayed ramp-up and fallback residual cost. | Reduced or zero product revenue. | Project depends on best-case assumptions to remain operable. |
Table 28.1. Every option must be compared against the same counterfactual, boundary and endpoint.
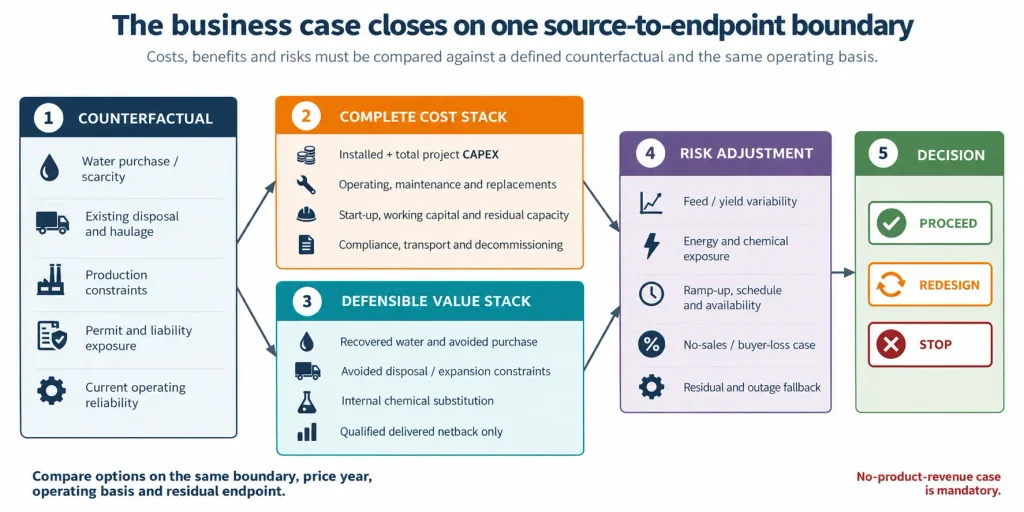
Figure 28.1. Business-case stack. The decision closes only when the counterfactual, complete cost stack, defensible value and downside risks share one boundary.
Define the economic boundary before estimating
The economic boundary should be identical to the material and responsibility boundary. It begins where the project changes the existing system and ends only when recovered water is delivered to its use, products are delivered under the agreed acceptance basis, and every liquid, solid, gas, cleaning waste and off-spec stream has a routine and backup endpoint. Costs left outside this boundary do not disappear; they are merely shifted to another budget, contractor or facility.
For a hub or hybrid architecture, the owner should separate source-site assets, transfer infrastructure, common utilities, hub processing, product finishing and residual capacity. Shared assets require an allocation driver such as committed hydraulic capacity, contained target load, batch time, utility demand or reserved contingency capacity. An allocation rule should explain the business case; it should not be chosen merely to make one participant’s economics appear favourable.
| Boundary block | Minimum scope | Primary cost owner | Allocation basis | Control |
|---|---|---|---|---|
| Source site | Segregation, pre-treatment, water recovery, storage, loading and local residuals. | Source owner or service provider. | Direct assignment to source. | No cost transfer to hub through an undefined gate fee. |
| Transfer system | Tanks/containers, pipeline or haulage, cleaning, return, disruption and custody. | Source, logistics contractor or hub. | Payload, trips, distance, reserved capacity. | Water mass and empty-return burden visible. |
| Shared hub assets | Reception, equalization, separation, utilities, laboratory, storage and redundancy. | Hub owner/operator. | Capacity or service driver tied to actual duty. | No double counting in source and hub estimates. |
| Product finishing | Purification, drying, packaging, QA, loading and rejection handling. | Hub or product business. | Product-specific incremental duty. | No allocation to the water train unless it is genuinely shared. |
| Residual capacity | Purge, sludge, mother liquor, unsold product and outage storage. | Party with legal and operational control. | Mass/volume and required standby capacity. | Zero-sales case remains fully costed. |
Table 28.2. The economic boundary follows the physical system and the contractual responsibility for each interface.
A credible estimate requires a technical baseline and work breakdown structure
A cost estimate cannot be more mature than the technical definition it represents. GAO and DOE guidance require the estimate to be linked to a documented technical baseline, schedule, work breakdown structure, ground rules and assumptions. The cost model should therefore receive the same feed cases, mass balances, operating philosophy, redundancy, materials, product specifications and residual routes used by the process design.
The work breakdown structure should be neither a vendor catalogue nor an accounting afterthought. It should decompose the project far enough to assign scope, quantities, estimating method, source, uncertainty, owner and update responsibility. Missing scope should remain visible as an allowance or evidence gap; it should not be hidden inside a single factor.
| Estimate control | Required record | Why it matters | Warning sign |
|---|---|---|---|
| Technical baseline | Design basis, normal/design/upset feed, flowsheet, mass balance, capacity, materials and redundancy. | Defines what is being priced. | Cost model uses a different recovery, flow or product basis than the process model. |
| Work breakdown structure | Equipment, installation, civils, utilities, buildings, storage, solids, controls, engineering and owner scope. | Prevents omissions and double counting. | Large undifferentiated ‘balance of plant’ or ‘miscellaneous’ line. |
| Schedule basis | Engineering, procurement, construction, commissioning, ramp-up and permitting sequence. | Time drives labour, escalation, temporary facilities and delayed benefit. | CAPEX assumes an immediate start and full-rate production. |
| Ground rules / assumptions | Location, currency, price date, taxes, duties, labour regime, contracting model and exclusions. | Makes estimates comparable and updateable. | Two options use different commercial or currency bases. |
| Data and method register | Vendor quote, quantity take-off, analogy, parametric method, factored allowance or expert judgement. | Shows evidence strength and maturity. | All figures presented with the same precision regardless of source. |
| Risk and update register | Uncertainty, identified risks, contingency method, owner, trigger and actual-cost updates. | Keeps the estimate controlled as design matures. | Contingency is a plug used to preserve a target number. |
Table 28.3. A cost estimate is reliable only when its technical, schedule, assumption and risk bases are traceable.
Separate package equipment, installed cost and total project cost
Package equipment cost is the price of a defined equipment supply. Installed cost adds the work required to place that equipment into an operating facility. Total project cost adds the site, integration, engineering, owner, start-up and risk provisions required to deliver the complete project. The master brief requires these categories to remain separate because a low package quote can coexist with a high-cost project once metallurgy, civil works, utilities, solids handling, interconnections and remote-site logistics are included.
UK infrastructure guidance states that a cost estimate evolves with scope and schedule maturity and should be presented as a range reflecting risk and uncertainty. The range should narrow as the project develops. This is more defensible than converting an early vendor quote into a false-precision total project cost.
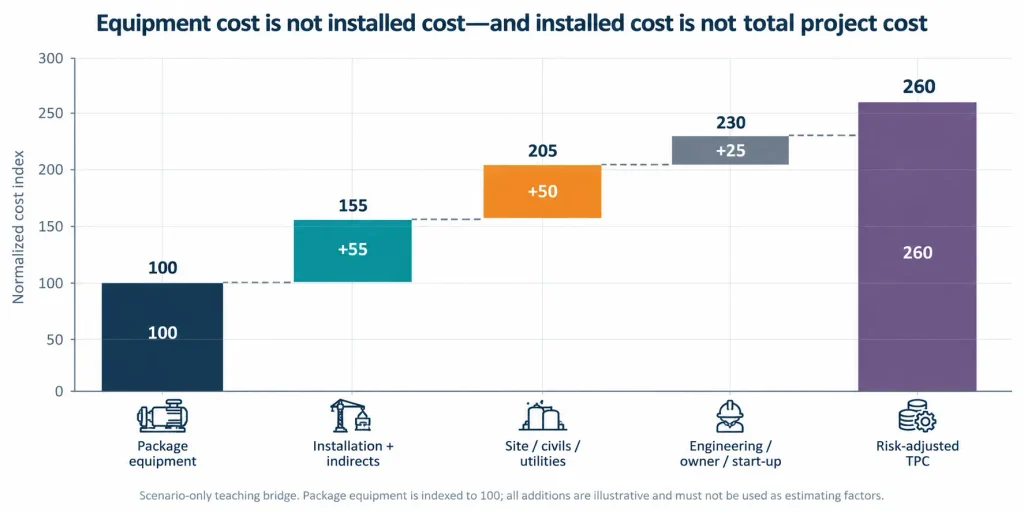
Figure 28.2. Scenario-only normalized cost bridge. Package equipment is indexed to 100; the additions are illustrative and must not be used as generic estimating factors.
| CAPEX layer | Include | Exclude or show separately | Evidence / maturity |
|---|---|---|---|
| Package equipment | Core skids, vessels, membranes, thermal equipment, pumps, proprietary controls and defined vendor scope. | Freight, installation, interconnections, utilities and owner scope unless explicitly included. | Quote or budget proposal with exclusions and validity date. |
| Direct installation | Foundations, structural steel, piping, electrical, instrumentation, insulation, painting and erection labour. | Offsites, owner’s costs and project contingency. | Quantity take-off, location factors and construction basis. |
| Site / common infrastructure | Buildings, roads, drainage, storage, power/steam/water upgrades, laboratories, workshops and residual facilities. | Product-specific finishing if separately evaluated. | Site layout, utility balance and constructability review. |
| Indirect / project delivery | Engineering, procurement, construction management, temporary facilities, commissioning and contractor indirects. | Financing and taxes where project convention treats them separately. | Execution strategy and schedule. |
| Owner / development | Permits, studies, land, owner team, insurance, legal/commercial work, qualification and start-up inventory. | Corporate overhead unrelated to project. | Owner estimate and responsibility matrix. |
| Contingency / escalation | Risk-based allowance, estimating uncertainty and time/currency escalation under a stated method. | Undefined scope or deliberate design changes. | Risk register, estimate range and price-year basis. |
Table 28.4. CAPEX must build from defined equipment scope to a risk-adjusted total project cost without hiding exclusions.
OPEX is an operating model, not an energy-and-chemicals subtotal
Operating cost must reflect how the facility will actually run: normal production, cleaning, start-up, turndown, planned and unplanned outages, product campaigns, rework, residual handling and restart. Electricity and chemicals are often visible, but labour, maintenance, membranes and media, corrosion inspection, laboratory release, sludge or salt handling, transport, compliance and standby capacity can decide the project.
EPA utility guidance treats asset management as the management of infrastructure to minimise the total cost of owning and operating assets while maintaining the required level of service. NIST life-cycle costing similarly evaluates initial and future costs over the study period rather than selecting the lowest initial cost. [6–8]
| OPEX family | Mandatory basis | Variable / fixed treatment | Common omission | Output |
|---|---|---|---|---|
| Electricity / thermal energy | Block duty, efficiency, tariff structure, demand charges, heat quality and operating hours. | Mostly variable; demand and capacity elements may be fixed. | Using nameplate SEC without actual operating profile. | Annual and unit energy cost by block. |
| Chemicals / consumables | Stoichiometry, excess, purity, cleaning, regeneration and delivery form. | Variable with feed and operating mode. | Ignoring reagent ions, wash water and disposal created by dosing. | Normal/design/upset consumption. |
| Membranes / media / parts | Life, replacement fraction, cleaning, storage, critical spares and freight. | Periodic or usage-driven. | Using warranty life as economic life. | Annualised and outage-linked replacement cost. |
| Labour / laboratory | Shift coverage, supervision, maintenance, product release, environmental monitoring and specialist support. | Mostly fixed with step changes by staffing model. | Treating an integrated ZLD/product plant as an unattended skid. | Organisation and annual labour cost. |
| Maintenance / integrity | Preventive, corrective, corrosion inspection, rotating equipment and major overhauls. | Fixed programme plus event costs. | No allowance for high-salinity materials and solids equipment. | Routine and major-maintenance schedule. |
| Residuals / logistics / compliance | Sludge, mother liquor, off-spec product, packaging, transport, permits, analysis and backup endpoint. | Variable plus contracted fixed capacity. | Assuming product sales remove all disposal obligations. | Routine and zero-sales residual cost. |
Table 28.5. OPEX should reproduce the operating model, replacement cycle and residual obligations—not only utility consumption.
Carry the full life cycle: development, ramp-up, replacement and closure
The operating phase is not a single stable year. The model should distinguish development and permitting, construction, commissioning, ramp-up, steady operation, major replacement, expansion and closure. Benefits should begin only when the corresponding capacity, quality and qualification are achieved. Product revenue should not start on the mechanical-completion date if buyer qualification or reliable on-spec production occurs later.
Schedule and cost are coupled. GAO’s schedule guidance notes that schedule slippage drives additional labour, supervision, rented facilities and other costs, and that schedule risk must be reflected in the life-cycle estimate. [10]
| Life-cycle phase | Cost treatment | Benefit treatment | Risk control |
|---|---|---|---|
| Development / permitting | Studies, tests, pilot, FEED, permits, commercial and legal work. | No operating benefit unless a separate early-use case exists. | Decision gates and sunk-cost visibility. |
| Construction / integration | Progress payments, owner oversight, temporary systems, escalation and interface work. | No full project benefit. | Integrated schedule and interface contingency. |
| Commissioning / ramp-up | Chemicals, utilities, off-spec production, rework, specialist labour and reduced availability. | Water/product credit only for released output. | Ramp curve and acceptance criteria. |
| Steady operation | Normal fixed and variable OPEX, maintenance and routine residuals. | Avoided cost and qualified value at demonstrated availability. | Operating-envelope and price basis. |
| Major replacement / turnaround | Membranes, media, equipment overhaul, refractory/heat-exchanger work and outage cost. | Reduced or interrupted benefit. | Replacement schedule and reserve. |
| Closure / residual liability | Decommissioning, cleaning, waste removal, restoration and contract termination. | Salvage only if defensible. | End-state and legal responsibility. |
Table 28.6. The business case must time costs and benefits across development, ramp-up, steady operation, replacement and closure.
Build the value stack from avoided cost before merchant revenue
The value side should follow the hierarchy established in Chapters 22–26. Recovered water, avoided disposal, internal substitution and production continuity usually have clearer users and baselines than merchant product sales. Each benefit should be incremental to the counterfactual and supported by a named mechanism, quantity, timing and owner.
HM Treasury guidance distinguishes financial impacts from broader economic or unmonetised effects and recommends evaluating costs, benefits and risks over the lifetime of the proposal. For an industrial owner, the same discipline means separating cash savings, production value, compliance or strategic value and non-monetised resilience rather than combining them into one unsupported revenue figure.
| Value route | Defensible basis | Timing / volume control | Do not count |
|---|---|---|---|
| Recovered water | Avoided marginal purchase, production or discharge cost for the named fit-for-purpose use. | Net released water after internal consumption and availability. | Gross permeate at a premium water price unrelated to actual use. |
| Avoided disposal | Baseline gate fee, transport, evaporation, injection or liability cost actually displaced. | Residual volume/mass avoided after all new sludges and purges. | Full baseline cost when a substantial residual route remains. |
| Production enabled / protected | Contribution or avoided interruption linked to a documented water/disposal constraint. | Capacity and probability attributable to project. | Entire plant revenue without causal evidence. |
| Internal chemical substitution | Delivered purchase cost displaced at accepted substitution ratio and quality. | Qualified on-spec quantity consumed internally. | Headline commodity price or 100% substitution. |
| Qualified external product | Delivered netback for actual grade, contract, accepted volume and rejection basis. | Only qualified placed volume; zero-sales downside retained. | Contained mass multiplied by spot price. |
| Liability / resilience / strategic value | Named risk reduction, permit pathway, supply security or option value. | Monetise only where method and decision use are defensible. | Arbitrary premium added to force positive economics. |
Table 28.7. Value is admitted only when its counterfactual, quantity, timing and receiver are explicit.
Prevent double counting through incremental allocation
A benefit or cost should appear once. Water value cannot simultaneously be counted as avoided purchase, full sales revenue and production uplift unless those are distinct, non-overlapping outcomes. Likewise, a precipitation step installed to protect membranes and make a magnesium product cannot allocate its full cost to both the water train and the product business.
The practical solution is an incremental sequence. First model the best non-product water/residual case. Then add each product or hub function and calculate the change in total project cost, operating cost, water performance, residuals and value. Shared costs can be allocated for reporting, but the investment decision should remain based on the change in the complete system.
| Potential overlap | Correct treatment | Audit question |
|---|---|---|
| Recovered water + avoided discharge | Count both only where water reuse and discharge reduction create separate, measured savings. | Are the same cubic metres generating two copies of one avoided cost? |
| Product revenue + avoided disposal | Credit both only for the portion sold and the residual cost genuinely avoided. | Is unsold/off-spec product still costed? |
| Pretreatment as water protection + product recovery | Model the common step once; allocate only the incremental purification/finishing burden to the product case. | Would the pretreatment exist without the product route? |
| Shared hub utility + source fee | Record the utility once and make the fee a transfer between parties, not a new system cost. | Does consolidation preserve total system cost? |
| Production uplift + corporate risk value | Use a causal production model; keep strategic value separate or qualitative unless monetisation is defensible. | Is a general resilience narrative being added to measured production value? |
| Contingency + risk-adjusted OPEX/revenue | Avoid charging the same expected event in base OPEX, contingency and probability-weighted value. | Where is each risk represented and who owns it? |
Table 28.8. Incremental modelling prevents the same water, product, asset or risk from being counted more than once.
Keep treatment economics and product economics distinct
The water and residual-management project should first stand on its own selected endpoint. Product recovery is then evaluated as an incremental decision unless product specification materially changes the base train. This prevents speculative revenue from subsidising a treatment system that is otherwise unjustified and prevents a valuable product step from being burdened with unrelated water-treatment cost.
Where the product route changes pretreatment, concentration, recovery, energy, residuals or reliability, the model must recalculate the complete system. The product is not a side spreadsheet; it is a system modification with its own qualification, market and fallback obligations.
| Case layer | Include | Economic output | Mandatory downside |
|---|---|---|---|
| Base water / residual case | Required treatment, reuse, MLD/ZLD endpoint and compliant residual route without product revenue. | Gross and net treatment cost; avoided water/disposal value. | Higher energy, poorer feed and lower availability. |
| Incremental product step | Additional separation, purification, finishing, QA, storage, logistics and off-spec route. | Incremental cost, incremental value and change to water/residual performance. | No-sales and lower on-spec yield. |
| Integrated revised train | All process changes required to meet product quality, including lost water recovery or extra residuals. | Total project economics versus base case. | Product failure while the main water duty remains mandatory. |
| Portfolio / multi-product case | Common and product-specific assets, order of recovery, interactions and shared constraints. | Total risk-adjusted value and each product’s incremental contribution. | One or more products removed; residual capacity retained. |
Table 28.9. Product value should enter as an incremental system decision, not as an unqualified subsidy to the water project.
Separate base cost, estimating uncertainty, project risk and contingency
Uncertainty is not one undifferentiated percentage. Base cost represents defined scope under stated assumptions. Estimating uncertainty reflects limited definition, quantities, productivity and pricing evidence. Project risk represents identifiable events or conditions. Contingency is the cost provision produced by the adopted uncertainty and risk method; it is not a substitute for missing scope or management reserve for deliberate changes.
UK cost-estimating guidance recommends presenting an anticipated final cost and a range of possible values, with project contingency informed by post-mitigation risk and uncertainty. The 2026 Green Book also requires uncertainty and optimism bias to be made visible rather than hidden in point estimates. [2,4]
| Cost / risk component | Meaning | Treatment | Do not use it for |
|---|---|---|---|
| Base estimate | Cost of defined scope under stated quantities, rates and execution assumptions. | Deterministic estimate with traceable source and price date. | Unknown scope. |
| Estimating uncertainty | Variation around quantities, rates, productivity and design maturity. | Range or probabilistic treatment linked to estimate class/maturity. | Known risk events already modelled elsewhere. |
| Project risk | Identifiable event or condition affecting cost, schedule, performance or revenue. | Risk register with probability, impact, mitigation and owner. | Normal recurring OPEX. |
| Contingency | Provision derived from residual uncertainty and project risk under the chosen confidence basis. | Held and governed at appropriate project/owner level. | Scope growth, enhancements or covering an unrealistic base. |
| Management reserve / change | Budget for approved changes or strategic decisions outside controlled baseline, where applicable. | Separate governance and change control. | Keeping a project inside a previously announced number. |
| Critical / discontinuity risk | Event that threatens project continuity or requires redesign. | Separate decision and fallback plan; not merely a larger contingency. | Claiming bankability while the event has no response. |
Table 28.10. Base cost, uncertainty, project risk, contingency and change are distinct controls.
State currency, price date, escalation, tax and financing boundaries
Two estimates cannot be compared until their monetary basis is aligned. The model should state currency, exchange-rate date or convention, base price date, real or nominal treatment, inflation and escalation assumptions, taxes and duties, financing boundary, depreciation or accounting treatment where relevant, and whether costs are equipment, installed, EPC or total project cost.
Chapter 29 will standardise the economic metrics. Chapter 28’s task is to ensure that the inputs are internally consistent and that financing effects are not confused with underlying technical cost. A project may be financially affordable under one capital structure but still have poor underlying economics; conversely, a technically sound project can fail because funding, cash timing or covenant conditions are unsuitable.
| Basis field | Required statement | Comparison control |
|---|---|---|
| Currency / FX | Reporting currency, source currency, exchange-rate date or scenario and hedging treatment. | Do not mix quote currencies at current spot rates with historic costs. |
| Price date | Month/year and index or reprice method. | Reprice old estimates rather than silently carrying nominal values. |
| Real / nominal | Whether general inflation and specific escalation are included. | Use matching discount and cash-flow basis. |
| Taxes / duties | VAT/sales tax, customs, withholding and recoverability. | Separate transfer taxes from economic resource cost where required. |
| Financing | Debt/equity, interest during construction, fees, reserve accounts and working capital boundary. | Keep project-finance cash flow distinct from unlevered technical economics. |
| Cost definition | Equipment, installed, EPC, owner cost, total project cost and exclusions. | Never compare categories with different scope labels. |
Table 28.11. Every business case needs one controlled monetary and financing basis before options are compared.
Use a controlled option model and mandatory downside set
A good business case remains auditable when assumptions change. Inputs should be stored once, units and denominators should be visible, and each option should draw from the same feed, utility, schedule, price and financial registers. The model should reconcile annual mass, cost and value to the process design and should identify which input drives each line.
Chapter 30 will develop sensitivity and uncertainty analysis in detail. At this stage, the business case must at least contain the counterfactual, lower-complexity alternative, selected case, no-product-revenue case and credible operating downside. This prevents the preferred option from being selected solely because it receives upside assumptions that the alternatives do not.
| Case | Required change from base | Decision question |
|---|---|---|
| Counterfactual / business as usual | Current cost, performance, constraints, risk and required future compliance investment. | What happens and what does it cost if the project is not implemented? |
| Lower-complexity alternative | Source reduction, reuse or MLD with named residual route. | Can the objective be achieved with less complexity and risk? |
| Selected case | Complete risk-adjusted project under expected operating and commercial basis. | Does the selected architecture create sufficient value and remain affordable? |
| No-product-revenue | All product sales removed; product residual and contractual obligations remain. | Can the water/residual project continue safely and lawfully? |
| Operating downside | Higher energy/chemicals, poorer feed, lower recovery/yield and availability. | Which assumptions can reverse the decision? |
| Delivery downside | Schedule delay, escalation, ramp-up extension, source default or hub outage. | Is there enough funding, contingency and fallback capacity? |
Table 28.12. A minimum option set prevents a preferred case from being supported by asymmetric assumptions.
Business-case acceptance gate
The business case may advance to metric standardisation only when the boundary, counterfactual, estimate basis, operating model, value routes and downside cases are all complete enough to support a decision. Weighted scoring cannot compensate for a missing residual route, unqualified revenue or an estimate that excludes major project scope.
| Gate field | Proceed | Conditional / recycle | Stop | Required record |
|---|---|---|---|---|
| Counterfactual and options | BAU, lower-complexity and selected cases share one boundary. | A comparator needs further definition. | Only the preferred vendor train is modelled. | Option register and boundary map. |
| CAPEX basis | Equipment, installed and total project costs are separated and traceable. | Site or owner scope remains provisional. | Package quote is presented as project CAPEX. | WBS, estimate basis and range. |
| OPEX / life cycle | Operating model, replacements, ramp-up and closure are included. | Some long-term costs need evidence. | Only energy and chemicals are counted. | Life-cycle cost register. |
| Benefits / value | Avoided costs and qualified value are incremental and timed. | One benefit remains conditional with limited credit. | Headline revenue or double counting controls the case. | Benefit register and evidence status. |
| Risk / contingency | Uncertainty, risk, contingency and fallback are distinct. | Risk model requires further data. | Contingency is an unsupported plug or critical risk has no response. | Risk register and contingency basis. |
| Downside operability | No-sales and operating downside retain lawful residual capacity. | Temporary fallback exists while permanent route is developed. | Project cannot operate without uninterrupted sales or best-case performance. | Scenario set and fallback design. |
| Governance / update | Owners, assumptions, change control and actual-cost update path are defined. | Model ownership or approval process incomplete. | No accountable owner or version control. | Model governance and assurance plan. |
Table 28.13. The business case advances only when scope, life-cycle cost, value, risk and fallback close on the same boundary.
Stop ruleStop or redesign when the project is attractive only because equipment price is treated as total project cost, benefits are counted more than once, product revenue starts before qualification, residual capacity is omitted, or the no-sales case cannot operate. Better definition is not a reason to preserve a weak concept; it is a reason to make the decision earlier. |
|---|
Handover to Chapter 29 — the correct economic metrics
Chapter 29 standardises denominators and investment metrics. It should receive a controlled option model rather than a collection of vendor prices and annual totals. Every cost and benefit must carry its physical denominator, time basis, price basis, system boundary and status.
The handover should make it possible to calculate cost per cubic metre of feed, water recovered and residual eliminated; cost per tonne of salt removed or product; net and levelized treatment cost; avoided disposal; and project metrics such as NPV, payback and IRR without changing the underlying mass, cost or value boundary.
| Handover field | Required basis for Chapter 29 | Metric risk if missing |
|---|---|---|
| Option and counterfactual | BAU, lower-complexity and selected cases on one source-to-endpoint boundary. | Incremental cost and benefit cannot be calculated. |
| Flow / mass denominators | Feed, recovered water, residual eliminated, salt removed and saleable product by operating case. | €/m³ and €/t claims use incompatible denominators. |
| CAPEX and schedule | Total project cost, expenditure profile, price date, escalation and commissioning/ramp-up. | NPV and levelized cost use the wrong timing or scope. |
| OPEX and replacement | Fixed/variable OPEX, availability, maintenance, replacement and closure profile. | Annual cost is not representative of project life. |
| Benefit register | Avoided water/disposal/production/substitution and qualified revenue with timing and quantity. | Benefits are double counted or applied to gross production. |
| Financial basis | Currency, real/nominal basis, discounting, tax and financing boundary. | NPV/IRR and affordability cannot be compared. |
| Risk cases | Expected, no-sales, operating downside and delivery downside. | Single-point metrics conceal decision reversal. |
| Evidence and ownership | Source, date, status, model owner, approval and update route. | Numbers cannot be audited or maintained. |
Table 28.14. Chapter 29 requires controlled denominators, timing and monetary bases—not isolated cost ratios.
Chapter conclusion
A bankable business case begins with the reason to act and the counterfactual, not with a technology quotation. It compares credible alternatives on the same source-to-endpoint boundary, builds package equipment into installed and total project cost, reproduces the real operating model over the full life cycle, and admits only benefits that are incremental, evidenced and timed.
The model must keep treatment and product economics distinct, prevent double counting, and separate base cost, uncertainty, risk, contingency and change. It should remain operable under no-product-revenue, lower-availability and delivery-delay cases, with every residual and contractual obligation visible.
Engineering establishes what the project is. The business case determines whether the complete project—including its interfaces, replacements, residuals, markets and risks—deserves capital. Chapter 29 now makes the denominators and investment metrics explicit.
Chapter 28 in one sentenceBuild from the counterfactual to total project cost, life-cycle OPEX, defensible incremental value and mandatory downside cases—then decide whether the complete project deserves to proceed. |
|---|