
Higher recovery is not automatically lower impact.
Controlled principleEnvironmental preference is a comparative claim. Options must deliver the same required service and be tested on the same feed, operating cases, product qualification and residual endpoints. Physical inventories remain visible even when impacts are normalized or monetized, and a weighted score cannot compensate for a failed permit, hazard, service or residual-route condition. |
|---|
Environmental assessment is a system comparison—not a recovery score
Chapter 30 handed forward scenario-linked physical inventories and economic cases. Chapter 31 asks whether the options that survive those downside tests also reduce total environmental burden. ISO 14040 and ISO 14044 structure life-cycle assessment around goal and scope, inventory, impact assessment, interpretation, reporting and review. For an industrial brine project, that discipline is useful even when a full comparative LCA is not yet justified.
The first environmental result is therefore not a single score. It is a transparent set of physical flows and local constraints: net water returned to a defined use; electricity and thermal energy by source; chemicals and consumables; direct and upstream emissions; solids and residual liquids; products and rejected output; transport; land; and effects on relevant receptors. A favourable change in one flow is not evidence of an overall improvement when another burden has merely moved outside the drawing boundary.
| Decision layer | Controlling question | Required output | Failure if omitted |
|---|---|---|---|
| Service | What water, residual-management and compliance service must every option deliver? | Common functional requirement and quality basis. | Options perform different jobs but are ranked as substitutes. |
| Inventory | What enters and leaves the source-to-endpoint boundary? | Water, energy, chemicals, emissions, solids, products, transport and infrastructure. | A burden disappears because it is assigned to another contractor or site. |
| Impact | Which environmental mechanisms and local receptors are material? | Selected impact categories plus permit- and site-specific thresholds. | Climate or recovery alone becomes the environmental decision. |
| Scenario | How do base and mandatory downside cases change the inventory? | Scenario-linked physical results and uncertainty ranges. | Only the optimistic operating state is assessed. |
| Decision | What cannot be traded off and what may be weighted? | Hard gates, comparative indicators, weighting basis and residual uncertainty. | A high aggregate score hides an unacceptable local condition. |
Table 31.1. Environmental assessment begins with a common service, complete inventory and explicit decision rules.
Fix the functional unit, counterfactual and source-to-endpoint boundary
Environmental comparisons are highly sensitive to the functional unit and multifunctionality treatment. A recent LCA of integrated seawater desalination and brine treatment found that methodological choices—including functional unit, allocation and treatment of waste heat—materially changed the reported results in that case. The lesson is not to copy those percentages; it is to make the project choices explicit and test them.
The preferred basis is the physical service needed by the owner. Depending on the decision, this may be treatment of a defined feed volume and chemistry, delivery of a stated quantity and quality of recovered water, reduction of a defined residual burden, or a combined service. Different denominators can be reported, but alternatives should be selected on one common function and counterfactual.
| Boundary field | Controlled basis | Include explicitly | Do not do |
|---|---|---|---|
| Functional unit | One stated service with quality, availability and time basis. | Feed treated; net qualified water; residual liquid/solute managed; service life. | Compare per-m³ values that refer to different water quality or endpoints. |
| Counterfactual | Current and credible future baseline without the project. | Water supply, treatment, disposal, compliance investment and operating risk. | Give the project avoided impacts against an obsolete or unlawful baseline. |
| Process boundary | Source generation through final water, product and residual destinations. | Pretreatment, concentration, finishing, storage, transport, disposal and fallback. | Stop at the vendor package battery limit. |
| Time and geography | Construction, ramp-up, normal operation, replacements, closure; stated locations. | Grid/fuel mix, water source, receptors, transport routes and climate conditions. | Use one generic background for materially different locations or years. |
| Infrastructure | Assets whose construction or lifetime differs materially among options. | Civils, tanks, ponds, pipelines, buildings, shared hub assets and replacement. | Omit infrastructure selectively from the more complex option. |
| Products and residuals | Qualified output and every rejected, unsold or off-spec stream. | Internal substitution, external delivery, rework, purge, waste and no-sales route. | Credit theoretical product mass that has no receiver or legal route. |
| End of life | Decommissioning, retained liabilities and final material destinations. | Demolition, contaminated equipment, pond closure, residual inventory and monitoring. | Assume end-of-life is identical without checking. |
Table 31.2. The functional unit and boundary must be fixed before environmental indicators are compared.
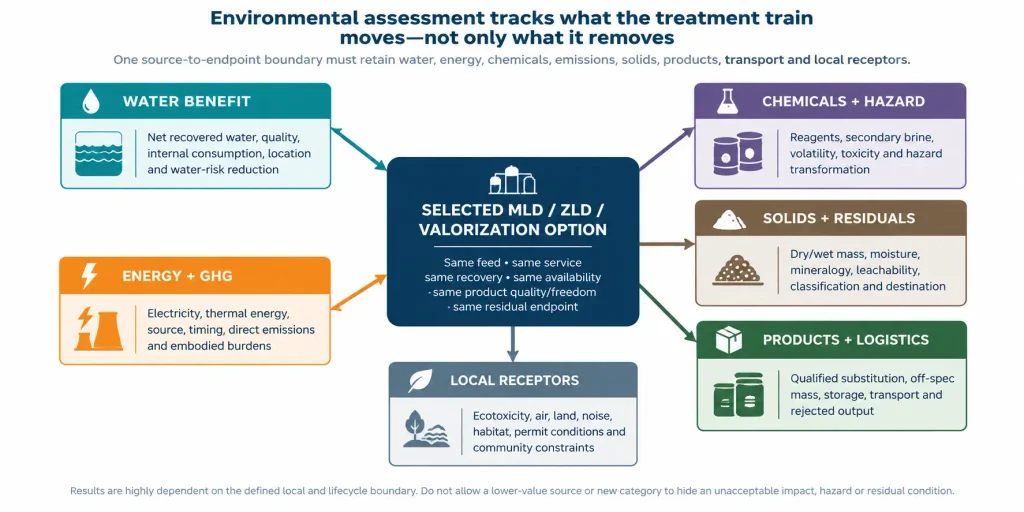
Figure 31.1. Environmental burden-transfer map. The treatment train is assessed by every material flow and receptor it changes, not only by liquid volume removed.
Water benefit must be net, quality-qualified and location-sensitive
Gross recovery is not the environmental benefit. Net recovered water subtracts internal dilution, washing, cooling, regeneration and cleaning demands, and it is credited only when the delivered quality, timing and location replace a credible water source or relieve a real constraint. ISO 14046 treats water footprint as an impact-oriented assessment that can stand alone or sit within a wider environmental assessment.
Global tools can support screening, but they cannot replace site analysis. Aqueduct 4.0 combines quantity, quality and administrative indicators and explicitly describes itself as a prioritization tool that should be augmented by local and regional assessment. The project should therefore separate volumetric water recovery from water-risk reduction, ecological flow, source reliability, discharge quality and the receiving environment.
| Water field | Required calculation or evidence | Local control | False credit to avoid |
|---|---|---|---|
| Gross recovery | Product-water flow divided by feed on stated stage/overall basis. | Use only as a process descriptor. | Calling gross recovery the water benefit. |
| Net recovered water | Qualified water delivered minus all new internal water consumption and losses. | State destination, quality and availability. | Ignoring wash, dilution, cooling or regeneration water. |
| Substitution | Actual source displaced and quantity that user can absorb. | Check seasonal demand, reliability and storage. | Crediting water that is produced but not used. |
| Source context | Scarcity, stress, quality, ecological and supply-security conditions. | Use basin/site evidence and future scenarios. | Treating one cubic metre as equal everywhere. |
| Residual liquid | Routine, upset and fallback discharge/injection/evaporation route. | Permit, mixing zone, receiving water and cumulative load. | Crediting recovery while ignoring the remaining concentrated stream. |
| Water quality burden | Treatment chemicals, contaminants, concentrate toxicity and receiving impacts. | Fit-for-purpose and receptor-specific testing. | Assuming lower liquid volume means lower aquatic impact. |
Table 31.3. Water benefit is net, usable and location-dependent—not a gross recovery percentage.
Separate electrical energy, thermal energy and greenhouse-gas accounting
Electrical and thermal duties should remain separate because source, quality, recoverability and emissions differ. Waste heat is not automatically burden-free: availability, temperature, alternative use, backup fuel, infrastructure and allocation must be stated. Conversely, grid electricity should not be frozen at one factor when the project life or procurement contract materially changes its carbon intensity.
The GHG Protocol Project Protocol quantifies project effects relative to a baseline. For this chapter, physical emissions remain the primary output: direct fuel and process emissions, purchased electricity/heat, major upstream chemicals and materials, transport, construction and replacements where material. Carbon prices and shadow values from Chapter 29 may be shown beside—never instead of—the tCO2e inventory.
| Energy / GHG field | Inventory basis | Scenario question | Common error |
|---|---|---|---|
| Electricity | kWh by block, voltage/source, losses and operating case. | How do grid factor, renewable contract, curtailment and downtime change results? | Multiplying one nameplate SEC by annual feed. |
| Thermal energy | Useful heat duty, temperature/pressure, source and conversion efficiency. | Is waste heat continuously available and what supplies the backup? | Treating low-grade and high-grade heat as equivalent. |
| Direct emissions | Fuel combustion, process gases, refrigerants and vents. | What occurs during startup, upset, cleaning and residual handling? | Counting only purchased electricity. |
| Embodied burden | Major equipment, membranes/media, chemicals, civils and replacement. | Which assets differ materially among options and over life? | Including construction in one option but not another. |
| Transport | Payload, distance, mode, empty return, cleaning and rejected loads. | What happens under buyer loss or disposal fallback? | Excluding product/hub logistics from the project boundary. |
| Credits | Only verified displacement on the same accounting basis. | Does recovered water/product actually displace the baseline supply? | Subtracting generic avoided emissions from all theoretical output. |
Table 31.4. Energy and GHG results require source, quality, timing and scenario-specific activity data.
Chemicals must be assessed by function, upstream burden and hazard transformation
Chemical consumption changes more than operating cost. Softening, pH control, antiscalants, cleaning, oxidation, reduction and product finishing may add secondary ions, create sludge, mobilize contaminants, increase salinity or change volatility and toxicity. The correct inventory states reagent identity, purity, active concentration, dose basis, excess, delivery form, packaging, upstream production where available and the destination of the added mass.
Hazard transformation is distinct from mass reduction. A process can reduce liquid volume while concentrating metals or persistent substances into a smaller, more hazardous residual; it can also convert a mobile dissolved species into a stable solid. The environmental case must therefore track speciation, phase, mobility, exposure pathway and final management rather than assuming that solids are safer than liquids.
| Chemical / hazard field | Minimum evidence | Environmental question | Failure signal |
|---|---|---|---|
| Reagent identity and dose | Chemical form, purity, active fraction, dose, excess and operating cases. | What upstream and downstream burdens arise per functional unit? | Generic “chemical use” total with no chemistry basis. |
| Added ions / by-products | Stoichiometric salt load and reaction products. | Does treatment create a new scaling, disposal or ecotoxicity burden? | Dose appears only as purchased tonnes. |
| Cleaning and regeneration | Frequency, volume, composition, neutralization and destination. | Are intermittent wastes material to annual and upset impacts? | CIP and regeneration streams disappear from the inventory. |
| Speciation and mobility | Oxidation state, pH/redox window, phase and binding. | Has hazard been destroyed, immobilized, transferred or concentrated? | Removal percentage is treated as risk elimination. |
| Volatile / air pathway | Potential stripping, aerosol, acid gas, ammonia or solvent emissions. | Does concentration create a new air-control duty? | All contaminants are assumed to remain in water/solids. |
| Substitution | Qualified internal or external chemical displacement. | Does the recovered chemical meet the same function and quality? | Full virgin-production credit for off-spec or unsold material. |
Table 31.5. Chemical assessment must close the added mass and show whether hazard is destroyed, immobilized or transferred.
Solids and residuals remain part of the environmental endpoint
ZLD eliminates routine liquid discharge inside a stated boundary; it does not eliminate waste. Softening sludge, crystallizer solids, filter cake, spent media, mother-liquor purge, cleaning residues and off-spec products require mass, moisture, composition, stability and destination. Wet mass should not be compared with dry salt mass, and a “solid product” should not receive a credit until Chapters 25 and 26 qualification and market gates are satisfied.
Leachability is jurisdiction- and material-specific. EPA Method 1311, for example, is designed to determine the mobility of organic and inorganic analytes in liquid, solid and multiphasic wastes under the U.S. RCRA framework; it is not a universal product-quality or environmental-safety test. The project must select the legally applicable test and the disposal or use scenario it is intended to represent.
| Residual field | Report | Testing / route question | Do not assume |
|---|---|---|---|
| Quantity | Dry mass, wet mass, moisture/free liquid and variability. | What mass leaves under base, upset and no-product cases? | Lower liquid volume means lower total waste. |
| Composition | Major phases, salts, metals, organics, additives and radionuclides where relevant. | Which constituents control classification or use? | A bulk assay proves stability or suitability. |
| Physical behaviour | Particle size, dusting, caking, self-heating, corrosivity and storage stability. | Can the material be handled through its real logistics chain? | A laboratory dry solid remains dry and stable in service. |
| Leachability / mobility | Applicable method, pH/redox context, liquid-to-solid ratio and analytes. | Does the test represent landfill, fill, reuse or exposure conditions? | One leach test proves safety in every destination. |
| Destination | Qualified product, controlled reuse, landfill, hazardous route, return or reprocessing. | Is routine and backup capacity permitted and contracted? | The preferred buyer is always available. |
| Long-term liability | Closure, monitoring, liner/pond condition and residual ownership. | Who retains responsibility after the plant stops? | Transfer of custody removes owner exposure. |
Table 31.6. Solids are assessed by dry and wet mass, composition, mobility, destination and long-term responsibility.
Ecotoxicity, air, land and receptors need local evidence beside LCA
Life-cycle indicators do not replace permit and receptor assessment. Where an aqueous discharge or receiving-water exposure remains, whole-effluent toxicity can measure the aggregate effect of the mixture on survival, growth and reproduction under specified methods. EPA WET methods illustrate the principle: testing the complete effluent can reveal mixture effects that analyte-by-analyte screening may miss. Applicability and species selection remain jurisdiction- and receptor-specific.
The same logic applies beyond water. Thermal equipment may create combustion emissions; dryers and solids handling may create dust or aerosol; evaporation ponds and landfills use land and may interact with habitat, groundwater and extreme weather; transport changes noise, traffic and accident exposure. These local conditions are not safely collapsed into a global carbon number.
| Receptor / pathway | Screening evidence | Project-specific evidence | Stop condition |
|---|---|---|---|
| Aquatic receptor | Salinity, temperature, pH, major ions, trace contaminants and toxicity potential. | Receiving-water model, permit limits, WET/ecotoxicity tests where required. | No lawful or environmentally acceptable routine/fallback endpoint. |
| Air | Fuel/process emissions, volatile species, aerosols, dust and odour. | Dispersion/control design and permit basis. | Concentration or drying creates uncontrolled hazardous emissions. |
| Land / habitat | Footprint of buildings, ponds, storage, roads, pipelines and disposal. | Site survey, sensitive receptors, flood/fire/extreme-weather exposure. | Required footprint or residual facility is incompatible with the site. |
| Groundwater / soil | Containment, liner integrity, spill pathways and leachate. | Hydrogeology, monitoring and closure design. | Credible contaminant pathway lacks containment or monitoring. |
| Community / workforce | Traffic, noise, dust, chemical handling and emergency response. | Stakeholder, occupational and emergency-management requirements. | Risk cannot be reduced to owner or regulatory tolerance. |
Table 31.7. Local receptor and permit conditions remain non-compensable environmental gates.
Product and avoided-burden credits require qualified displacement
Multifunctional brine systems produce water, chemicals, minerals and residual services. ISO 14044 requires transparent treatment of multifunctionality, and the European Commission Environmental Footprint methods provide detailed life-cycle modelling rules for products, electricity, transport, infrastructure, packaging and end of life. The selected method must be stated because allocation, system expansion and substitution can materially alter conclusions.
The conservative project rule is to separate physical production from environmental credit. A credit is earned only for the qualified volume that displaces a named baseline product or service under the same quality and delivery conditions. Off-spec, unsold, stored, reprocessed or disposed output remains a burden. No-sales and buyer-loss cases must retain the product-train energy, chemicals and residual obligations unless the design can bypass them.
| Output status | Environmental treatment | Evidence required | Downside treatment |
|---|---|---|---|
| Internal substitution | Credit the avoided site supply only to the extent of actual use. | Specification, user acceptance, metered demand and displaced process. | Cap at demand; retain purchased backup and rejected output. |
| Qualified external product | Use stated allocation/substitution method and delivered quantity. | Buyer-approved specification, placement, transport and baseline product. | Reduce/withdraw credit under rejection or buyer-loss case. |
| Candidate product | Show production inventory; credit only as conditional sensitivity. | Qualification plan and evidence state. | No-credit case remains primary until qualified. |
| Off-spec / unsold | Treat as rework, storage or residual according to actual route. | Expected fraction, composition and capacity. | Full quantity moves to fallback route. |
| Shared process output | Apply one documented multifunctionality method consistently. | Causal relation or allocation basis and sensitivity. | Test method choice where it can switch the decision. |
Table 31.8. Environmental credits follow qualified displacement—not theoretical recovered mass.
Use LCA, permit assessment and risk analysis for different questions
The European Commission Environmental Footprint method includes multiple impact categories such as climate change, toxicity, ecotoxicity, eutrophication, land use, water use and resource use. [9,10] A broad category set helps reveal cross-media burden, but not every early project needs a publication-grade LCA. The method should be proportionate to the decision and data maturity.
A screening inventory can identify dominant flows and missing endpoints. A comparative LCA can evaluate life-cycle trade-offs when system boundaries and data are mature. Environmental impact assessment, permitting and ecological risk work address location-specific receptors and legal conditions. These tools complement rather than substitute for one another.
| Assessment tool | Best question | Minimum output | Cannot conclude alone |
|---|---|---|---|
| Physical inventory | What material and energy flows change? | Scenario-linked quantities, sources and destinations. | Potential environmental significance without characterization/context. |
| Comparative LCA | Which alternative has lower potential life-cycle impacts on a common function? | Goal/scope, inventory, impact categories, interpretation, sensitivity and review. | Permit compliance or safety at a specific site. |
| Water-footprint / risk assessment | Where and how does water use/pollution affect water-related risk? | Location, source, quality, scarcity/stress and affected users/ecosystems. | Process performance or complete cross-media burden. |
| EIA / permit assessment | Can the project operate acceptably at this site? | Receptors, emissions/discharges, mitigation, monitoring and legal conditions. | Upstream product and energy burdens outside the site. |
| Hazard / ecological risk assessment | What exposure and consequence follow from the material and pathway? | Hazard, fate, exposure, receptor and uncertainty. | Overall life-cycle preference among options. |
Table 31.9. Environmental methods answer different questions and should be combined at the decision boundary.
Build a multi-criteria scorecard only after hard gates are passed
Normalization and weighting can support interpretation, but they introduce value choices. ISO/TS 14074 provides additional guidance for normalization, weighting and interpretation beyond ISO 14040 and ISO 14044. [11] The project should first identify non-compensable gates—permit, service reliability, acute hazard, residual route and owner constraints. Only options that pass those gates should enter a weighted comparison.
The scorecard below is deliberately scenario-only. It demonstrates that water-risk reduction may increase while energy, GHG, chemical and solids burdens also increase. The numbers are ordinal illustrations, not generic performance data, and must not be transferred to a project. Real scoring requires measured or modelled physical results, orientation, normalization basis, uncertainty and a documented owner-approved weighting process.
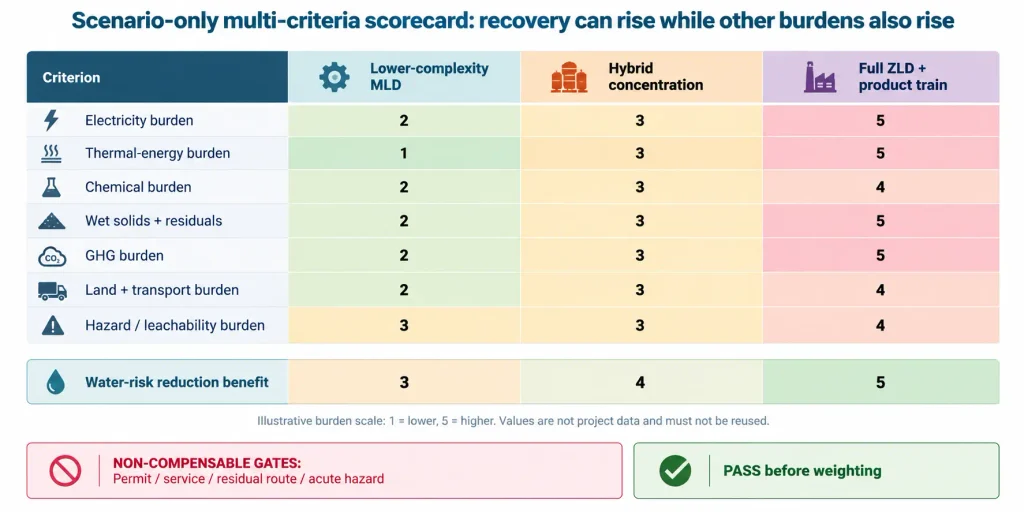
Figure 31.2. Scenario-only multi-criteria scorecard. Higher recovery can coincide with higher burdens; hard environmental gates must pass before weighting.
| Scorecard control | Required rule | Why it matters | Failure signal |
|---|---|---|---|
| Hard gates | Pass/fail for permit, service, hazard, residual route and non-negotiable owner constraints. | Prevents compensation of an unacceptable condition. | Weighted total advances an option that cannot lawfully or safely operate. |
| Indicator orientation | State whether higher is better or worse and retain physical unit. | Avoids mixing benefits and burdens. | A high score has different meanings across rows. |
| Normalization | State reference, range, benchmark or target and date. | Makes dimensionless scores reproducible. | Scores are assigned by visual judgement. |
| Weighting | Document stakeholders, rationale and sensitivity. | Makes value choices visible. | Weights are tuned to select the preferred technology. |
| Uncertainty | Show evidence state and range for each material indicator. | Prevents false ranking when options overlap. | Tiny score differences are treated as decisive. |
| Scenario symmetry | Use the same base and downside cases for all options. | Tests resilience rather than optimistic design points. | Preferred option receives more favourable assumptions. |
Table 31.10. A multi-criteria scorecard is an interpretation layer, not a substitute for inventory, gates or uncertainty.
Link environmental results to the same downside scenarios as the business case
Environmental performance should be recalculated for the base, higher-energy, poorer-feed, lower-availability, no-product and compound cases handed over by Chapter 30. The environmental downside is not always the economic downside. Lower availability may reduce annual electricity but worsen unit burden, increase startup waste and require backup disposal. Poorer feed may reduce recovery, increase chemical dose and change residual classification. Buyer loss may eliminate avoided-burden credits and redirect output to a more intensive residual route.
| Scenario | Environmental changes to recalculate | Decision question | Required mitigation / evidence |
|---|---|---|---|
| Higher energy | Electricity/heat activity, source mix, backup fuel, GHG and air emissions. | Does the option remain preferable under credible energy conditions? | Energy contract, waste-heat reliability, efficiency guarantee and source sensitivity. |
| Poorer feed | Dose, scaling control, recovery, purge, solids composition, hazard and leachability. | Does chemistry change the endpoint or create a new hazard? | Representative sampling, speciation/modelling and pilot evidence. |
| Lower availability | Startup/CIP waste, standby utilities, net output and fallback disposal. | Does reduced service increase unit burden or breach capacity? | Storage, redundancy, bypass and residual capacity. |
| No product / buyer loss | Credit removed; transport/storage/rework/disposal and off-spec mass added. | Can the water project operate without environmental reliance on sales? | Bypass design, fallback permit and residual contract. |
| Compound downside | Linked changes in feed, energy, availability and product route. | Do cross-media burdens or local thresholds switch the decision? | Integrated scenario, threshold and owner action. |
Table 31.11. Environmental scenarios must change the physical inventory and endpoint—not only the carbon factor.
Environmental acceptance gate
An option may advance only when the comparative environmental boundary closes and no non-compensable condition is hidden by aggregation. Weighted scoring cannot rescue a missing residual route, an untested hazard transformation, an unqualified product credit or an environmentally unacceptable site endpoint.
| Gate field | Proceed | Conditional / recycle | Stop | Required record |
|---|---|---|---|---|
| Common service and boundary | Options deliver the same stated service on one source-to-endpoint boundary. | Minor allocation/interface remains and is bounded. | Options perform different functions or omit different endpoints. | Goal, scope and boundary register. |
| Physical inventory | Water, energy, chemicals, emissions, solids, products and transport close by scenario. | Secondary upstream data remain provisional. | Material flows or residual destinations are missing. | Scenario inventory and mass/energy closure. |
| Local thresholds | Permits, receptor limits, hazard and land constraints are credible. | Approval path or mitigation is identified but incomplete. | No lawful/acceptable routine or fallback endpoint. | Permit, receptor and mitigation register. |
| Credits and multifunctionality | Only qualified displacement receives credit; method and sensitivity are stated. | Candidate credit shown separately as conditional. | The environmental case depends on theoretical or double-counted credit. | Product-credit and allocation record. |
| Uncertainty and scenarios | Material sensitivities and mandatory downsides are recalculated. | One evidence gap is owned and bounded. | Environmental preference exists only in the optimistic case. | Environmental sensitivity and scenario pack. |
| Decision and monitoring | Hard gates, comparative indicators, owner decision and operational KPIs are defined. | Monitoring plan needs final thresholds. | Composite score has no auditable decision rule. | Environmental decision and monitoring plan. |
Table 31.12. Environmental preference advances only when physical inventories, local gates, credits and downside cases are auditable.
Stop ruleStop, simplify or re-stage the project when higher recovery creates an unacceptable energy, chemical, air, land, ecotoxicity or residual burden; when the environmental result depends on unqualified product credits; or when a weighted score hides a failed permit, hazard, service or fallback condition. The correct environmental optimum may be controlled discharge, MLD, hybrid treatment or ZLD depending on the local system. |
|---|
Handover to Chapter 32 — from initial screening to FEED
Chapter 32 defines what each project-development stage can legitimately conclude. It should receive the selected environmental boundary, physical inventory, material impact pathways, hard gates, scenario sensitivities, monitoring needs and unresolved evidence—not a final “sustainability” label. Decision maturity must match evidence maturity.
At opportunity screening, the package may be a directional inventory and fatal-flaw review. At pre-feasibility it should include option-comparable balances, credible endpoints and material sensitivities. Pilot, feasibility, pre-FEED and FEED should progressively replace assumptions with representative operating data, qualified residual/product routes, permit evidence and monitorable guarantees.
| Handover field | Required basis for Chapter 32 | Development risk if missing |
|---|---|---|
| Environmental objective | Named water, discharge, hazard, carbon, land or risk outcome and owner constraints. | Testing and design optimize indicators that do not control the project. |
| Functional unit and boundary | Common service, counterfactual, geography, life and source-to-endpoint scope. | Environmental claims change as the project matures. |
| Inventory and scenarios | Base/downside water, energy, chemicals, emissions, solids, products, transport and infrastructure. | Stage estimates omit the burdens most likely to grow at scale. |
| Local gates | Permit route, receptors, hazard/leachability, land and fallback endpoint. | Pilot success cannot be converted into a lawful project. |
| LCA / impact method | Selected categories, data quality, multifunctionality, normalization/weighting and review need. | Comparative results are not reproducible or decision-relevant. |
| Evidence plan | Sampling, laboratory, pilot, vendor data, residual tests, monitoring and responsible owner. | Uncertainty is carried forward without a dated resolution gate. |
| Performance requirements | Physical KPIs and environmental guarantees with conditions and measurement methods. | Procurement receives aspirations instead of testable obligations. |
Table 31.13. Chapter 32 needs an evidence-maturity package, not an unsupported claim that one endpoint is sustainable.
Chapter conclusion
Environmental assessment changes the question from “How much liquid is eliminated?” to “What complete burden is created or avoided by delivering the required service?” The answer must retain net water benefit, energy source and quality, greenhouse gases, chemicals, hazard transformation, solids and residuals, ecotoxicity, air, land, transport, products and local receptors on one source-to-endpoint boundary.
LCA provides a disciplined framework for life-cycle comparison, while water-risk, permit, receptor and hazard assessments preserve the local conditions that a global impact score cannot replace. Product credits are conditional on qualified displacement; solids remain an endpoint; and physical inventories remain visible even when indicators are normalized, weighted or monetized.
The environmentally preferred option is therefore the one that delivers the required water and residual-management service while passing non-compensable gates and minimizing total local and life-cycle burden under credible downside cases. That option is not necessarily the one with the highest recovery.
Chapter 31 in one sentenceOptimize total environmental outcome—not recovery alone—because every additional separation can transfer burden into energy, chemicals, emissions, solids, transport or hazardous residuals. |
|---|