
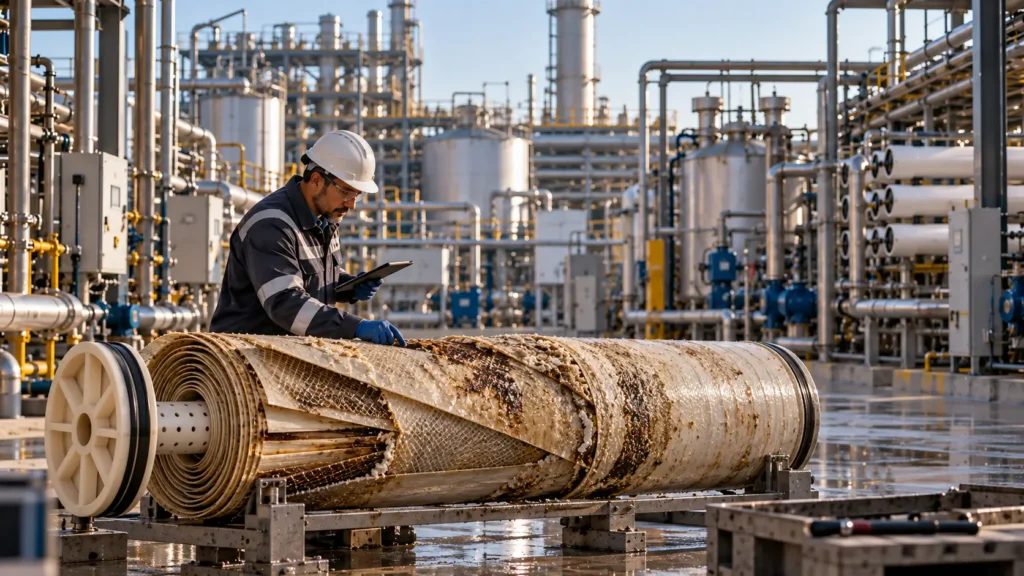
Failure often begins in framing, not equipment.
Controlled principleMost MLD/ZLD failures are not isolated equipment defects. They are propagated decision errors: an incomplete feed basis, an undefined endpoint, a chemistry or solids constraint that was deferred, a commercial assumption presented as certainty, or an operating burden that the owner was never equipped to carry. The first failed component is often only where the earlier error becomes visible. |
|---|
Failure begins upstream of the failed component
A useful failure review starts by separating the visible event from the earliest unsupported assumption that made the event consequential. A membrane may foul, a crystallizer may lose capacity, a centrifuge may blind or a storage tank may fill; none of those observations alone establishes the project root cause. Chapter 35 therefore hands this chapter operating evidence—trends, interventions, downtime, corrosion findings, residual bottlenecks and commercial fallback use—rather than a retrospective label of “operator error.” [BC-35]
Current whole-train research reaches the same systems conclusion. ZLD/MLD performance depends on interactions among pretreatment, concentration, crystallization and final residual management; optimizing one block does not optimize the treatment train. The failure question is therefore: which decision or interface allowed a local deviation to become a service, cost, compliance or commercial failure?
| Failure layer | Typical initiating error | Visible symptom | What the review must test | Corrective level |
|---|---|---|---|---|
| Framing | Problem, endpoint or boundary not defined | A technically impressive block solves the wrong duty | Was water, liquid residual, solids and product destination defined before selection? | Reframe objective and boundary |
| Characterization | Single or non-representative analysis | Unexpected scaling, fouling, yield or chemistry shift | Did the design basis represent normal, design and upset distributions? | Resample and rebuild basis |
| Chemistry | TDS used as the main descriptor | Scale, corrosion, precipitation or incompatibility | Were ion loads, speciation, additives, temperature and concentration effects modelled/tested? | Redesign chemistry and pretreatment |
| Integration | Recycle, purge or owner interfaces omitted | Accumulation, bottlenecks, hidden owner scope | Did every stream and interface close under steady and upset states? | Close balances and interfaces |
| Solids/residuals | Separation proven but solids handling not proven | Storage fills, cake is wet, disposal route fails | Was throughput, dewatering, off-spec and fallback capacity demonstrated? | Redesign solids/residual system |
| Operating model | Capability assumed rather than designed | Manual workarounds, late detection, long recovery | Can owner staff detect, intervene, maintain and restart within the availability basis? | Change design, staffing, automation or support |
| Commercial/contract | Revenue, guarantees or exclusions are optimistic | Treatment depends on buyer/vendor/owner not under control | Does the water/residual obligation survive no-product and guarantee-exclusion cases? | Reallocate risk or simplify project |
Table 36.1. Failure should be traced from the visible event back to the earliest decision, evidence or interface that allowed it to propagate.
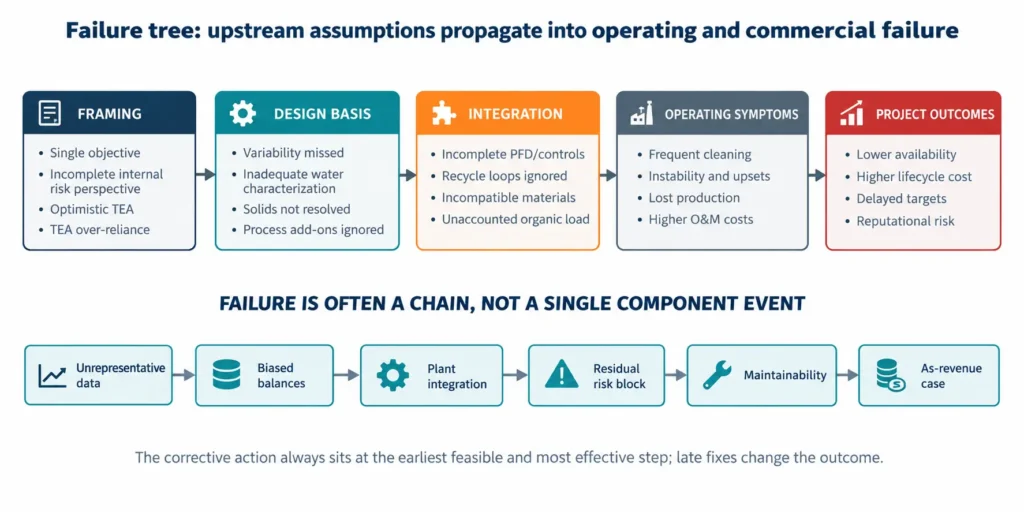
Figure 36.1. Failure tree. Framing, design-basis and integration errors propagate into operating symptoms and project outcomes; the visual is a causal decision map, not a frequency model.
A single analysis converts variability into a design surprise
A single laboratory sheet cannot establish a design feed. ISO 5667-1 treats sampling-programme design as part of obtaining fit-for-purpose water data, while ISO 5667-3 addresses preservation, handling, transport and storage because composition can change between collection and analysis. For industrial wastewater, the additional problem is process variability: production campaigns, cleaning events, reagent changes, recycle conditions and upstream operating modes can create chemistry that never appears in a convenient grab sample.
The failure mechanism is predictable: a nominal analysis is converted into one simulation, one equipment duty and one guarantee envelope; the plant then sees a distribution. The correct basis is not “more samples” in the abstract. It is a sampling plan tied to the operating states that can control scale, corrosion, recovery, product quality or residual generation.
| Weak evidence | What it hides | Operational consequence | Required correction |
|---|---|---|---|
| One grab sample | Temporal and campaign variability | Off-design chemistry becomes routine | Map production states and sample each decision-relevant state |
| Average only | Short-duration peaks and low-flow concentration | Constraint appears only during peak or upset | Carry normal, design and upset cases |
| Old sample / poor preservation | Precipitation, volatilization, oxidation or biological change | Laboratory matrix differs from plant matrix | Control preservation, holding time and sample condition |
| Incomplete ion suite | Charge imbalance and missing scaling species | Speciation and salt balance cannot close | Complete analytical basis and charge/mass checks |
| No additives history | Antiscalant, coagulant, biocide or CIP residuals | Unexpected fouling, product contamination or reaction demand | Map all routine and non-routine chemical inputs |
| No flow/time basis | Concentration is mistaken for annual load | Equipment, storage and product scale are mis-sized | Pair concentration with flow distributions and operating hours |
Table 36.2. Data failure occurs when sampling does not represent the operating states that control the design.
Equipment-before-endpoint creates a local optimum
A project can buy a technically capable concentrator and still fail because the last liquid, solid or product stream has no acceptable destination. Equipment-first development reverses the required decision sequence. The endpoint should determine how much concentration is valuable, which species must be removed, what residual form is acceptable, and whether ZLD is necessary at all. [BC,1]
| Equipment-first statement | Missing endpoint question | How failure appears | Better framing |
|---|---|---|---|
| “Maximize RO recovery” | What is the allowable concentrate endpoint? | Scaling control and pretreatment expand without clear value | Optimize recovery against residual route and whole-train burden |
| “Install a crystallizer” | What solid quality and disposal/offtake route is required? | Mixed salt or wet solids have no routine destination | Define solid endpoint, moisture, impurity and fallback first |
| “Recover every mineral” | Which material has a qualified user and positive delivered netback? | Process complexity grows faster than bankable value | Screen product, market, scale, legal route and logistics first |
| “Zero liquid means zero waste” | Where do sludge, purge, mother liquor and cleaning waste go? | Liquid liability is shifted into unmanaged solids or intermittent waste | Track every routine and non-routine stream to an endpoint |
Table 36.3. Equipment selection cannot compensate for an undefined water, liquid-residual, solid or product endpoint.
TDS-only design hides the chemistry that actually fails
TDS describes the aggregate dissolved load but not the reactions that control treatability. Two streams with similar TDS can have very different calcium, sulfate, silica, alkalinity, magnesium, organics, oil, metals, additives and temperature—and therefore very different saturation, fouling, corrosion, precipitation and product-quality behaviour. Brine-composition reviews also emphasize that operating and seasonal variability changes these constraints.
| TDS-blind omission | Why it matters at concentration | Possible symptom | Evidence needed |
|---|---|---|---|
| Calcium + sulfate | Ion activity and supersaturation rise as water is removed | Gypsum/anhydrite deposition, plugging, seed burden | Ion-specific balance, speciation/saturation and real-matrix test |
| Silica / silicate chemistry | Solubility and polymerization depend on pH, temperature and matrix | Hard-to-clean scale, declining heat/mass transfer | Dissolved/colloidal silica basis, pH-temperature path and testing |
| Alkalinity / carbon chemistry | pH shift and CO2 transfer change carbonate saturation | Unexpected carbonate precipitation or reagent demand | Alkalinity, inorganic carbon, gas transfer and pH control basis |
| Organics / oil / polymers | Concentration and thermal history can change fouling behaviour | Membrane fouling, foaming, crystal contamination | Fractionated organics/oil, additives and pilot exposure |
| Chloride + temperature + pH | Materials exposure changes along the train and during cleaning | Localized corrosion, leaks, contamination | Materials/corrosion review under process and cleaning envelopes |
| Trace metals / impurities | Species can concentrate into product or residual phases | Off-spec product or hazardous residual | Detection limits, partitioning and product/residual analyses |
Table 36.4. TDS is a mass descriptor; failure mechanisms are controlled by ion-specific chemistry, contaminants, temperature and operating history.
Scaling, silica, sulfate and corrosion are coupled risks
Scaling risk intensifies as concentration changes activity, supersaturation, temperature and local surface conditions. Modern ZLD/MLD literature treats mineral scaling as a central limit for membrane-based brine concentration, while conventional thermal systems also rely on pretreatment, materials selection and operating controls to keep heat-transfer surfaces and crystallization loops functional.
Corrosion cannot be separated from scale control. Acidification, caustic operation, oxidants, chloride concentration, temperature and cleaning chemicals alter the materials exposure at the same time that they change scaling and fouling. A flowsheet that solves saturation on paper but creates an unqualified metallurgy or cleaning envelope has merely moved the failure mechanism.
| Mechanism | Precursor that should be visible | Common design error | Failure consequence | Control evidence |
|---|---|---|---|---|
| Sulfate scale | Rising Ca/SO4 load, saturation margin, deposition trend | Assuming average chemistry or antiscalant closes all cases | Pressure drop, heat-transfer loss, plugging, cleaning | Speciation + real-matrix concentration/pilot evidence |
| Silica/silicate | Silica trend, pH-temperature path, recovery dependence | Treating silica as one fixed solubility number | Irreversible/slow-cleaning deposition and flux loss | Matrix-specific testing and cleaning/recovery evidence |
| Carbonate/hydroxide | pH, alkalinity, Ca/Mg and reagent control | Ignoring local pH or overdosing effects | Scale, sludge burden, poor separation | Reaction model plus kinetics/solid-liquid testing |
| Corrosion | Potential, temperature, chloride, pH, oxidants, inspection data | Selecting material from nominal feed only | Leaks, contamination, unplanned replacement | Materials envelope including CIP/upset conditions |
| Mixed deposit | Simultaneous inorganic/organic/solid exposure | Testing pure salts or synthetic water only | Deposit behaves unlike modelled single-phase scale | Real-feed long-duration test and deposit analysis |
Table 36.5. Scaling and corrosion should be controlled as interacting chemistry, materials and cleaning problems—not isolated saturation-index checks.
Antiscalant overconfidence is not a pretreatment strategy
Antiscalants can be useful tools, but their effect is chemistry-, dose-, mineral- and process-specific. Research on high-recovery membrane systems shows that scaling remains a design constraint and that pretreatment choices such as antiscalant addition or ion-selective removal change both recovery potential and downstream disposal duty. DuPont likewise treats feed composition, pH, temperature, recovery and concentration polarization as factors that influence RO performance and recommends normalization to distinguish expected shifts from deterioration.
The failure is not “antiscalant does not work.” It is using antiscalant as permission to omit the precipitation pathway, competing scales, solids route, cleaning burden or upset case. A chemical programme should sit inside a control strategy with validated operating limits and an alternative when those limits are exceeded.
| Overconfidence pattern | Why it fails | Required proof | Fallback if margin disappears |
|---|---|---|---|
| One vendor dose at one analysis | Feed and concentration path vary | Dose-response evidence over representative chemistry and recovery | Lower recovery, condition feed or remove limiting ion |
| Saturation index treated as guarantee | Kinetics, surfaces and mixed deposits are not captured by one index | Pilot/field evidence plus trend monitoring | Trigger condition-based intervention before irreversible loss |
| No antiscalant residual/product check | Polymer/reagent can partition to solids, product or mother liquor | Residual/product analysis and qualification | Destroy/remove additive or accept non-product residual route |
| Cleaning assumed to reset performance | Deposit may not be fully reversible and cleaning creates waste | Demonstrated restoration, waste volume and material compatibility | Redesign pretreatment or replacement philosophy |
Table 36.6. Antiscalant is one control layer; it should not substitute for chemistry, solids, monitoring and fallback design.
Mother liquor turns a “closed loop” into an accumulation loop
A crystallizer does not automatically create a chemically closed system. Species that do not enter the desired crystal phase remain in solution and can accumulate through recycle. Reagent ions, trace contaminants, organics, antiscalants and off-spec fines may progressively change viscosity, boiling behaviour, crystal purity, corrosion, foaming and downstream product acceptance. The master therefore requires explicit mother-liquor recycle and controlled purge logic. [BC]
| Accumulating species / property | Where it enters | What it can change | Required control | Failure signal |
|---|---|---|---|---|
| Non-crystallizing ions | Feed + reagent additions | Ionic strength, phase behaviour, purge volume | Steady-state salt balance and purge setpoint | Model closes only with zero purge |
| Organics / antiscalant | Feed and chemical programme | Foaming, nucleation, crystal surface contamination | Long-duration recycle test and product analysis | Pilot purity declines with cycles |
| Trace contaminants | Feed, corrosion, reagents | Product specification or residual classification | Partitioning analysis and controlled bleed | On-spec early batches become off-spec later |
| Fines / suspended solids | Nucleation and attrition | Viscosity, filtration, heat transfer and carryover | Particle-size, classification and solids-removal strategy | Slurry density or filterability drifts |
| Water imbalance | Wash water, condensate losses, cleaning | Concentration and equipment duty | Full water balance including intermittent streams | “Closed loop” requires unexplained water removal/addition |
Table 36.7. A recycle loop requires an impurity-accumulation model and a controlled purge; otherwise “closure” is only hydraulic.
Weak solid-liquid testing turns chemistry success into a handling failure
Precipitating the right mineral is not enough. The plant must continuously separate, wash, dewater, store and move the resulting solids at the required throughput. Laboratory tests that report removal efficiency but omit settling, filtration, cake moisture, particle-size distribution, rheology and wash demand cannot support a full-scale solids-handling design. Chapter 33 therefore required integrated precipitation, crystal-growth and solid-liquid-separation evidence before scale-up. [BC-33]
| Evidence gap | Why bench chemistry can look successful | Scale-up failure | Minimum evidence before design freeze |
|---|---|---|---|
| No kinetics / ageing | Equilibrium removal appears high | Residence time or downstream precipitation is wrong | Time-resolved precipitation and maturation basis |
| No particle-size distribution | Total mass is correct | Settling, filtration and centrifuge performance are unpredictable | PSD across representative runs and recycle |
| No dewatering test | Dry-solids calculation looks simple | Wet cake mass, hauling and storage multiply | Cake moisture, filtration/centrifuge cycle and wash demand |
| No recycle solids exposure | Fresh batch is clean | Seeds/fines/impurities alter nucleation and separability | Continuous/cyclic test with representative recycle |
| No off-spec route | Every batch is assumed useful | Rejected solids stop the water plant | Quarantine, rework, storage and compliant disposal capacity |
Table 36.8. Solids-management evidence must prove throughput and separability, not only precipitation yield.
Assumed salt sales can make an uneconomic residual look profitable
A recovered salt is not automatically a product. Previous chapters require specification, repeatable quality, lawful status, a qualified internal user or buyer, viable logistics and risk-adjusted netback before product revenue enters the base case. This matters because current brine-valorization reviews still identify scale-up, material performance, energy and economic viability as major constraints, with large-scale recovery concentrated mainly in water and bulk salts.
Failure occurs when a treatment obligation is sized around sales that have not been qualified. Product rejection then becomes a water-plant problem: storage fills, crystallizer inventory grows, the buyer outage becomes a process constraint, and the project discovers that the “product” has an ordinary disposal cost.
| Commercial assumption | What must be demonstrated | Failure if assumed | Bankable treatment in model |
|---|---|---|---|
| All recovered salt is saleable | Specification yield and on-spec fraction | Off-spec inventory accumulates | Credit only qualified on-spec volume |
| Commodity price = project revenue | Delivered grade, contract, freight and rejection terms | Netback collapses after logistics/conditioning | Use delivered netback or avoided purchase |
| One buyer will absorb output | Demand, delivery profile, credit and outage plan | Receiver outage stops production | Multiple outlets, storage or full residual fallback |
| Waste can become product by naming it | Jurisdiction-specific legal pathway and buyer acceptance | Material remains regulated waste | Retain compliant waste route until status is established |
| Product train is essential to economics | No-sales/no-revenue case survives | Water project becomes hostage to market | Separate treatment obligation from upside product case |
Table 36.9. Product revenue is an evidence-gated upside; it should not conceal the residual fallback obligation.
Missing residual costs do not disappear—they return as operating constraints
Whole-train analysis consistently shows that disposal choices interact with pretreatment, concentration and crystallization. A business case that prices the concentrator but omits sludge, mixed salt, purge, off-spec product, cleaning waste, transport, storage and contingency capacity is not incomplete by a small margin; it has omitted the physical endpoint of the process.
| Residual | Routine quantity basis | Cost / capacity drivers | Downside case | Failure signal |
|---|---|---|---|---|
| Pretreatment sludge | Stoichiometry + impurities + moisture | Dewatering, reagents, bins, transport, disposal | Higher dose / poorer dewatering | Sludge storage constrains feed |
| Mother-liquor purge | Steady-state accumulation balance | Hazard, transport, treatment/disposal route | Higher impurity load / no product route | Purge reduced to protect economics |
| Mixed crystals / salt | Salt mass + retained liquor + on-spec fraction | Drying, packaging, landfill/offtake, dust/corrosion | Buyer rejection / wet product | Crystallizer cannot dispatch solids |
| Cleaning waste | CIP/cleaning volume, chemicals and frequency | Neutralization, storage, treatment and scheduling | Cleaning frequency increases | CIP delayed because waste route is full |
| Emergency liquid | Trip/restart volume and duration | Tankage, fallback transfer and permit route | Long outage / simultaneous upstream flow | Plant can fail only by overflowing |
Table 36.10. Residual costs and capacities must be tied to physical quantities, moisture, frequency and compliant destinations.
Operators inherit every assumption that engineering did not close
Operations failure is often blamed on people after the project has already imposed an unrealistic operating model. IEC 60300-3-10 treats maintainability and maintenance as lifecycle activities linked to reliability and availability, while IEC 60300-3-14 treats supportability as a planned balance of performance, cost and risk. [7,8] For MLD/ZLD, that means access, isolation, diagnostics, laboratory response, specialist skills, spare lead time, cleaning duration and restart procedures belong in design and procurement—not in post-startup improvisation.
| Design assumption | What operators actually need | Failure mode when absent | Design/procurement control |
|---|---|---|---|
| “Automation will handle it” | Reliable instruments, validated logic, alarm priorities and manual fallback | Bad data or alarm flood delays intervention | Critical-tag register, proof tests and degraded-mode logic |
| “Routine maintenance” | Access, isolation, lifting, wash-down, waste route and staffing duration | Task is deferred or takes far longer than availability model | Maintainability review and executable job plan |
| “Vendor support available” | Named response time, data access, tools, software and escalation | Minor fault becomes extended outage | Support SLA, data rights, owner diagnostic capability |
| “Spares are standard” | Criticality, installed base, lead time, storage and obsolescence plan | Single component creates long shutdown | Strategic/operating spare register and replenishment basis |
| “Operators can restart” | Preservation, sequence, chemistry stabilization, residual capacity and acceptance checks | Repeated trips or long unstable recovery | Demonstrated shutdown/restart procedure |
Table 36.11. “Operator error” should not be used where the design assumed unavailable information, access, competence, spares or support.
Guarantees fail when the feed, boundary and exclusions do not match operation
A guarantee protects the owner only when the performance metric, feed envelope, battery limits, test method, duration, exclusions and remedies are measurable on the same basis as the service obligation. Chapter 34 established this procurement rule; Chapter 35 then converted it into operating tasks. A project failure occurs when the plant is routinely outside the guaranteed basis or when owner-supplied pretreatment, chemicals, residual disposal or product offtake are the unpriced conditions that make the guarantee possible. [BC-35]
| Guarantee weakness | What it looks like in operation | Why it fails | Required correction |
|---|---|---|---|
| Narrow feed window | Normal plant chemistry is “out of spec” | Guarantee excludes routine variability | Align design/guarantee envelope with representative feed distributions |
| Peak metric only | Acceptance test passes; sustained duty drifts | Duration, cleaning and availability are not guaranteed | Include normalized sustained performance and operating-state basis |
| Owner scope hidden | Vendor performance depends on owner systems not in price | Interface failure has no accountable party | Battery-limit and interface responsibility matrix |
| Residual/product exclusion | Water production assumes uninterrupted disposal/offtake | Third-party outage disables treatment | Fallback route and risk allocation independent of sales case |
| No measurable remedy | Failure is debated rather than corrected | Metric or test method is ambiguous | Pre-agreed test protocol, tolerances, data rights and remedy path |
Table 36.12. Guarantees become operational only when the routine feed, complete boundary, test method and remedy are aligned.
Downtime is often an integration failure rather than a component MTBF problem
Water-service availability can be eroded by many small losses that sit outside the “main” technology package: chemistry excursions, additional cleaning, solids-handling delays, unavailable residual capacity, slow restart, common utilities, laboratory release, a blocked product outlet or a specialist-support dependency. IEC dependability guidance is useful precisely because reliability, maintainability, supportability and availability interact rather than exist as separate vendor numbers.
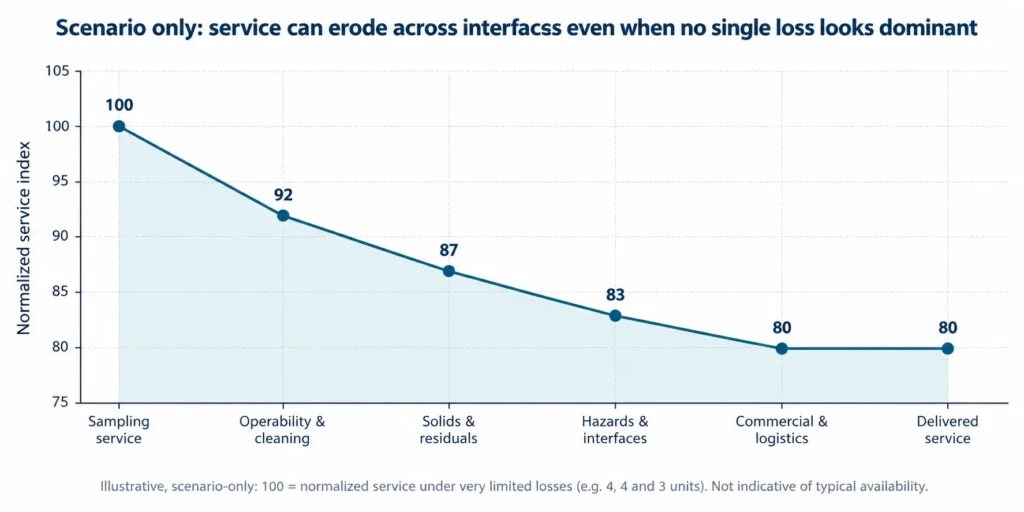
Figure 36.2. Scenario-only service-erosion graph. Starting from 100 normalized service units, illustrative losses of 8, 5, 4 and 3 units show how interface burdens can reduce delivered service to 80 units. The values are explicit assumptions, not empirical failure rates or availability benchmarks.
| Downtime event | Primary cause class | Secondary dependency | What should be recorded | Design decision informed |
|---|---|---|---|---|
| Scale/fouling clean | Chemistry / pretreatment | CIP waste, chemicals, labour, restart | Trigger, duration, restoration and residual waste | Pretreatment, recovery, cleaning philosophy |
| Solids system stop | Solids / mechanical | Storage, transport, wash water, upstream hold | Throughput, inventory, moisture and recovery time | Redundancy, buffer and dewatering capacity |
| Corrosion repair | Materials / chemistry | Isolation, spare material, contamination | Location, mechanism, exposure and repair | Material upgrade and inspection interval |
| Instrument/control trip | Automation / measurement | Bad data, interlocks, vendor support | Tag quality, alarm sequence, false/true trip | Sensor redundancy and degraded-mode control |
| Receiver/disposal outage | Commercial / residual | Storage and alternate route | Inventory growth, time-to-limit, fallback use | Independent residual capacity and contract structure |
| Restart delay | Procedure / integration | Chemistry stabilization, heat-up, product release | Safe-state duration and step that controlled restart | Procedure, automation, storage and staffing |
Table 36.13. Downtime records should identify the interface that extended loss of service, not only the component that tripped first.
A failure review should change the project—not merely assign blame
The output of a failure review should be a controlled change to the evidence, design, operating model or commercial basis. A root-cause statement that cannot change a decision is not enough. The review should distinguish immediate cause, enabling conditions and systemic cause; quantify service and residual impact; test whether the same mechanism exists elsewhere; and then update the basis of design, procedures, spares, monitoring, training, guarantees or economics through management of change.
| Review field | Minimum record | Weak answer | Decision output |
|---|---|---|---|
| Event definition | Service lost, duration, stream state, environmental/product impact | “Unit failed” | Common event boundary and consequence |
| Immediate cause | Observed physical/control mechanism with evidence | Component name | Repair action and verification |
| Enabling condition | Why protection, detection or fallback did not contain the event | “Operator did not respond” | Control, alarm, access, spare or procedure change |
| Systemic cause | Earlier assumption, interface or governance gap | “Unexpected chemistry” | Design-basis, procurement or commercial correction |
| Recurrence check | Other equipment/streams exposed to same mechanism | Only failed asset inspected | Fleet/train-wide inspection or model update |
| Change control | Owner, due date, test, documentation and acceptance | Informal workaround | MOC, updated SOP/model/drawing and closure evidence |
Table 36.14. A failure review is complete only when it changes the controlled project basis and verifies the corrective action.
Failure-prevention acceptance gate
Before a project leaves Part VII, the owner should be able to show that the recurring failure mechanisms in this chapter are either designed out, bounded by monitored operating limits, or provided with a finite fallback. The gate is not a promise that the plant will never fail; it is evidence that foreseeable failure does not automatically become loss of the water/residual obligation.
| Gate field | Proceed | Conditional / recycle | Stop | Required record |
|---|---|---|---|---|
| Feed / variability | Representative normal/design/upset basis is controlled | One non-fatal state needs closure testing | Guarantee/design still rests on one nominal analysis | Sampling and design-basis register |
| Chemistry / materials | Scale, fouling, corrosion and cleaning envelopes are demonstrated | Bounded uncertainty has monitor/trigger plan | Critical mechanism has no validated control or compatible material | Chemistry/materials risk register |
| Recycle / mother liquor | Accumulation and purge balances close | Pilot duration leaves one bounded scale-up uncertainty | Closed-loop claim depends on zero/unpriced purge | Recycle and purge mass balance |
| Solids / residuals | Routine, off-spec and upset routes have finite capacity | One contingency route is time-limited but controlled | Water service depends on indefinite storage or assumed salt sale | Residual-capacity and fallback plan |
| O&M / support | People, monitoring, access, cleaning, spares and restart are executable | Early-life support closes a defined competence gap | Availability depends on unavailable skills/spares/vendor access | O&M readiness and support plan |
| Guarantees / commercial | Measured guarantee and no-revenue fallback preserve service | One commercial allocation awaits bounded closure | Routine operation falls outside guarantee or buyer outage stops treatment | Guarantee, interface and risk-allocation matrix |
| Learning / failure control | Events, deviations and MOC update the controlled basis | Data integration improvement remains open | Recurring workaround is accepted as normal operation | Failure/MOC register |
Table 36.15. Failure risk is controlled only when data, chemistry, residuals, O&M and commercial dependencies have observable limits and fallback routes.
Stop ruleStop, simplify or re-stage when the project still depends on one analysis, an undefined residual endpoint, TDS-only chemistry, an untested scale/corrosion mechanism, zero mother-liquor purge, unproven solids handling, assumed salt sales, omitted residual costs, unavailable operator/support capability, or a guarantee that excludes routine operating conditions. Do not use a more complex flowsheet to hide an earlier unresolved failure mechanism. |
|---|
Handover to Chapter 37 — power and cooling systems
Chapter 37 begins the sector playbooks with power and cooling systems. It should not restart from a generic ZLD flowsheet. It should receive the failure controls developed in Part VII and apply them to cooling-tower blowdown, boiler blowdown and flue-gas-desulfurization wastewater, where utility integration, water-reuse value, silica/hardness/sulfate chemistry and the residual route can determine the practical MLD/ZLD endpoint. [BC]
The handover should therefore identify the sector-specific reason to act, operating and chemistry distributions, pretreatment constraints, concentration limits, solids/residual route, owner utility interfaces, operability basis and the failure mechanisms that require explicit validation. The sector chapter can then show how the common decision framework changes when the industrial process—not the brine technology—sets the boundary.
| Handover field | Required basis for Chapter 37 | Failure lesson carried forward |
|---|---|---|
| Source stream / duty | Cooling-tower, boiler, FGD or other defined stream; normal/design/upset flow | Do not merge chemically different streams without testing the benefit |
| Utility context | Make-up water value, steam/electricity, heat integration, site outages | Energy and water value are plant-system variables, not package constants |
| Chemistry distribution | Silica, hardness, sulfate, chloride, alkalinity, organics/metals/additives as relevant | Do not design from TDS or one analysis |
| Pretreatment / concentration envelope | Constraint-removal logic, recovery limits, cleaning and materials basis | Antiscalant or vendor recovery claim does not replace evidence |
| Solids / residual endpoint | Sludge, concentrate, crystals, purge and fallback capacity | ZLD is not achieved by creating an unmanaged solid stream |
| O&M / availability | Operator tasks, monitoring, cleaning, spares, emergency and restart basis | Sector solution must fit owner capability and outage philosophy |
| Economics / commercial | Avoided water/disposal, full residual costs, no-product-revenue case | Salt/product upside cannot carry the essential water obligation |
Table 36.16. Chapter 37 should apply the common failure controls to the specific utility, chemistry and residual realities of power and cooling systems.
Chapter conclusion
MLD and ZLD projects rarely fail for one reason. A visible membrane, evaporator, crystallizer, centrifuge or corrosion event often sits at the end of a longer chain: the wastewater was characterized too narrowly; the endpoint was not defined; TDS substituted for chemistry; scale, silica, sulfate or materials exposure was underestimated; recycle accumulation and solids handling were not proven; residual costs were omitted; product revenue was assumed; or the operating and contractual model could not sustain the designed duty.
The most useful failure lesson is therefore upstream. Define the problem and endpoints before equipment. Design for chemistry distributions, not one analysis. Treat antiscalant as one control layer, not permission to ignore precipitation. Close mother-liquor and residual balances. Pilot the solids and integrated recycle. Qualify products before revenue. Design maintenance, spares, monitoring and restart with the owner. Make guarantees measurable on the routine feed and complete boundary. When these controls are present, equipment failures can remain bounded events instead of becoming project failures.
Chapter 36 in one sentenceFailure often begins in framing, not equipment: the project becomes resilient when every assumption that can stop water service has representative evidence, an observable limit, an owner and a fallback. |
|---|